40% renewable and rising: How the NEM’s transition stacks up

Reality Check is a quarterly series by energy analyst Allan O’Neil, offering a clear-eyed look at how Australia’s electricity system is really tracking – using fresh data, grounded analysis and Open Electricity’s system-wide tools.
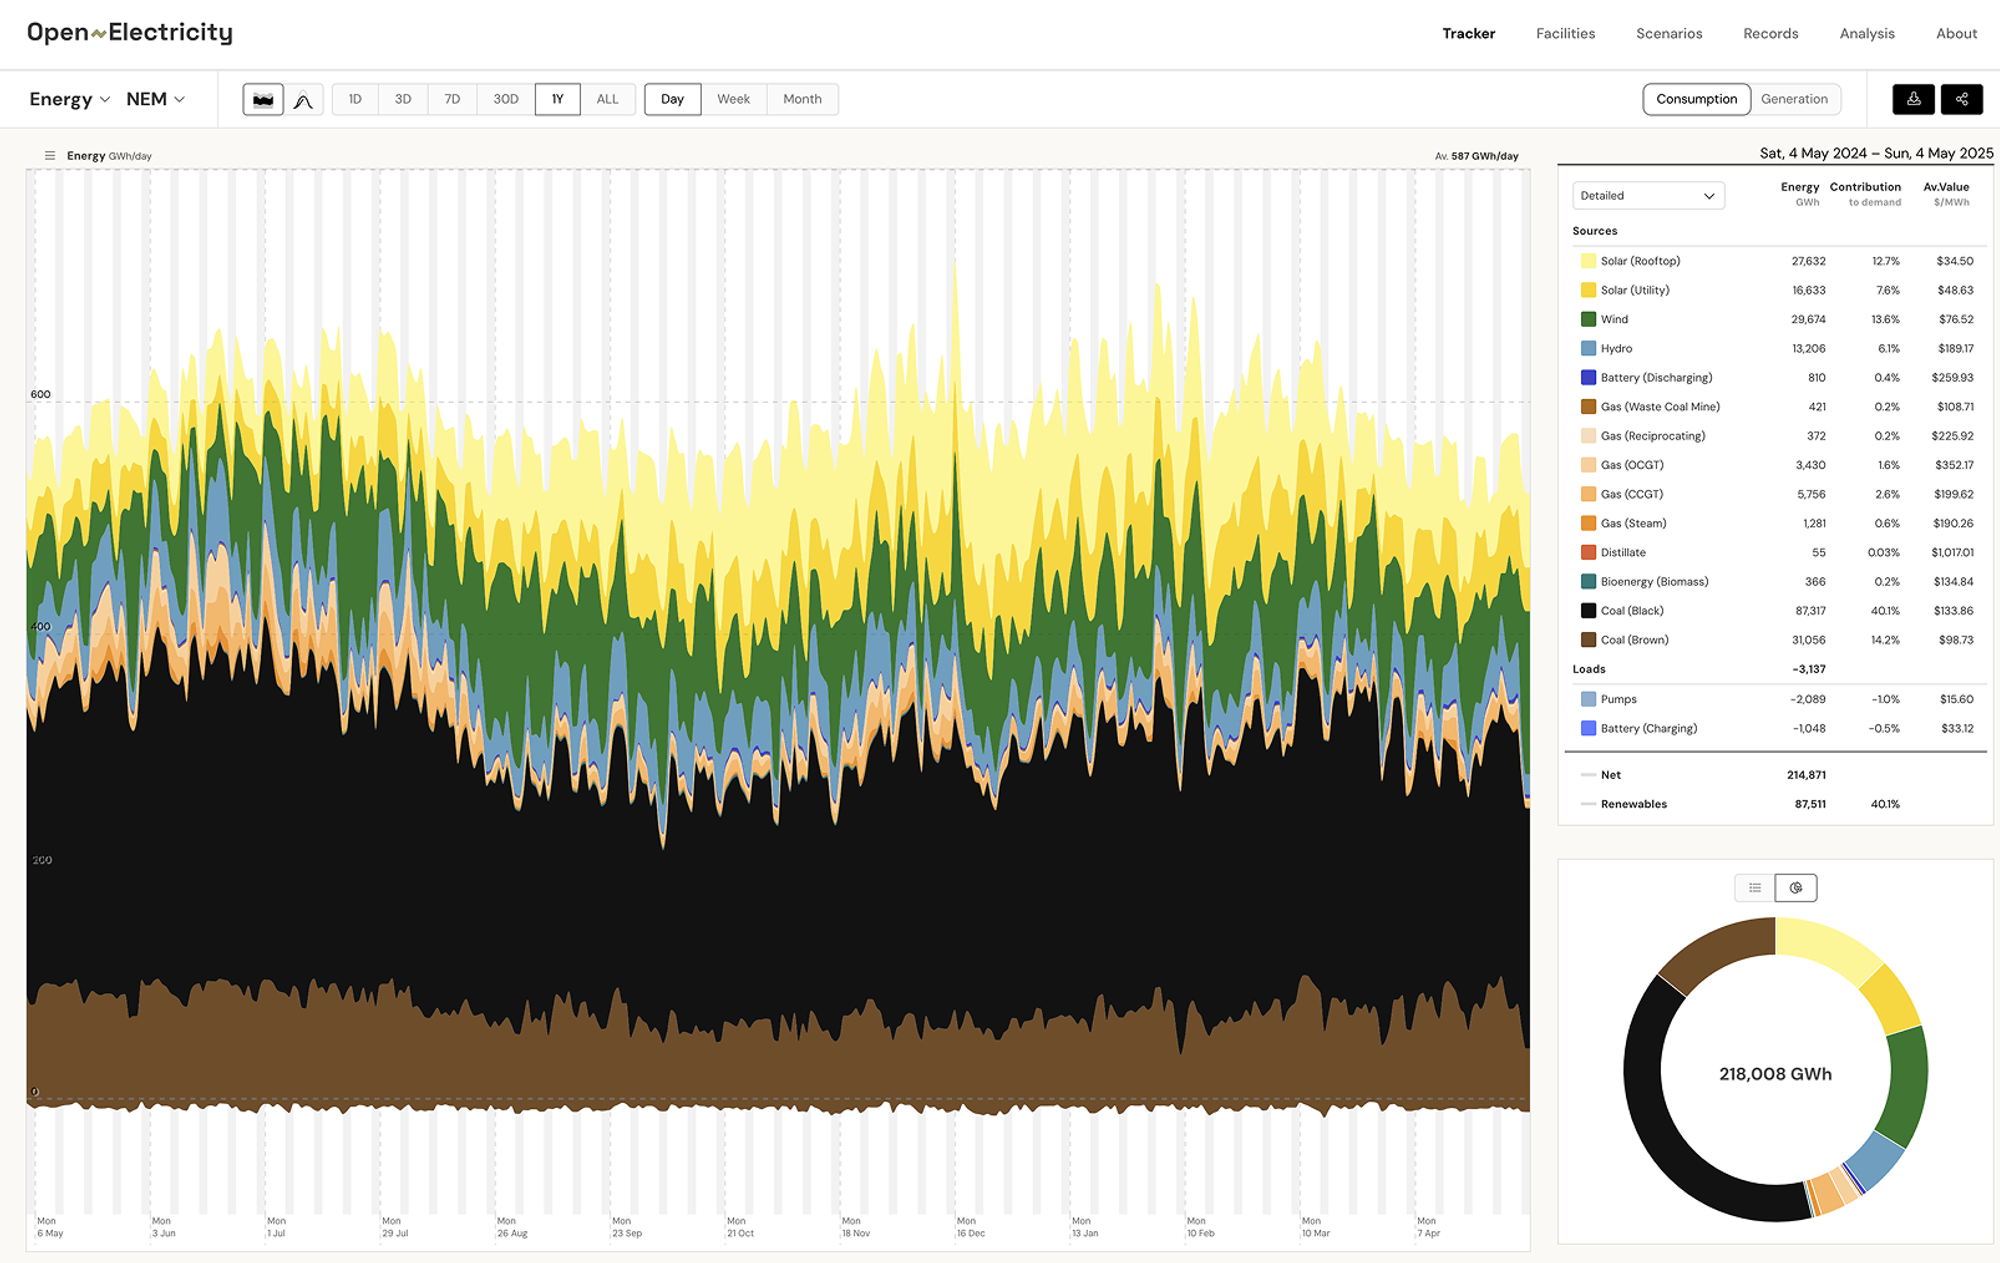
Earlier this month, renewables (large and small-scale) ticked past 40% of annual supply to the NEM - a significant milestone for Australia’s energy transition. Open Electricity’s one year view of the NEM’s generation mix shows the breakdown of this total.
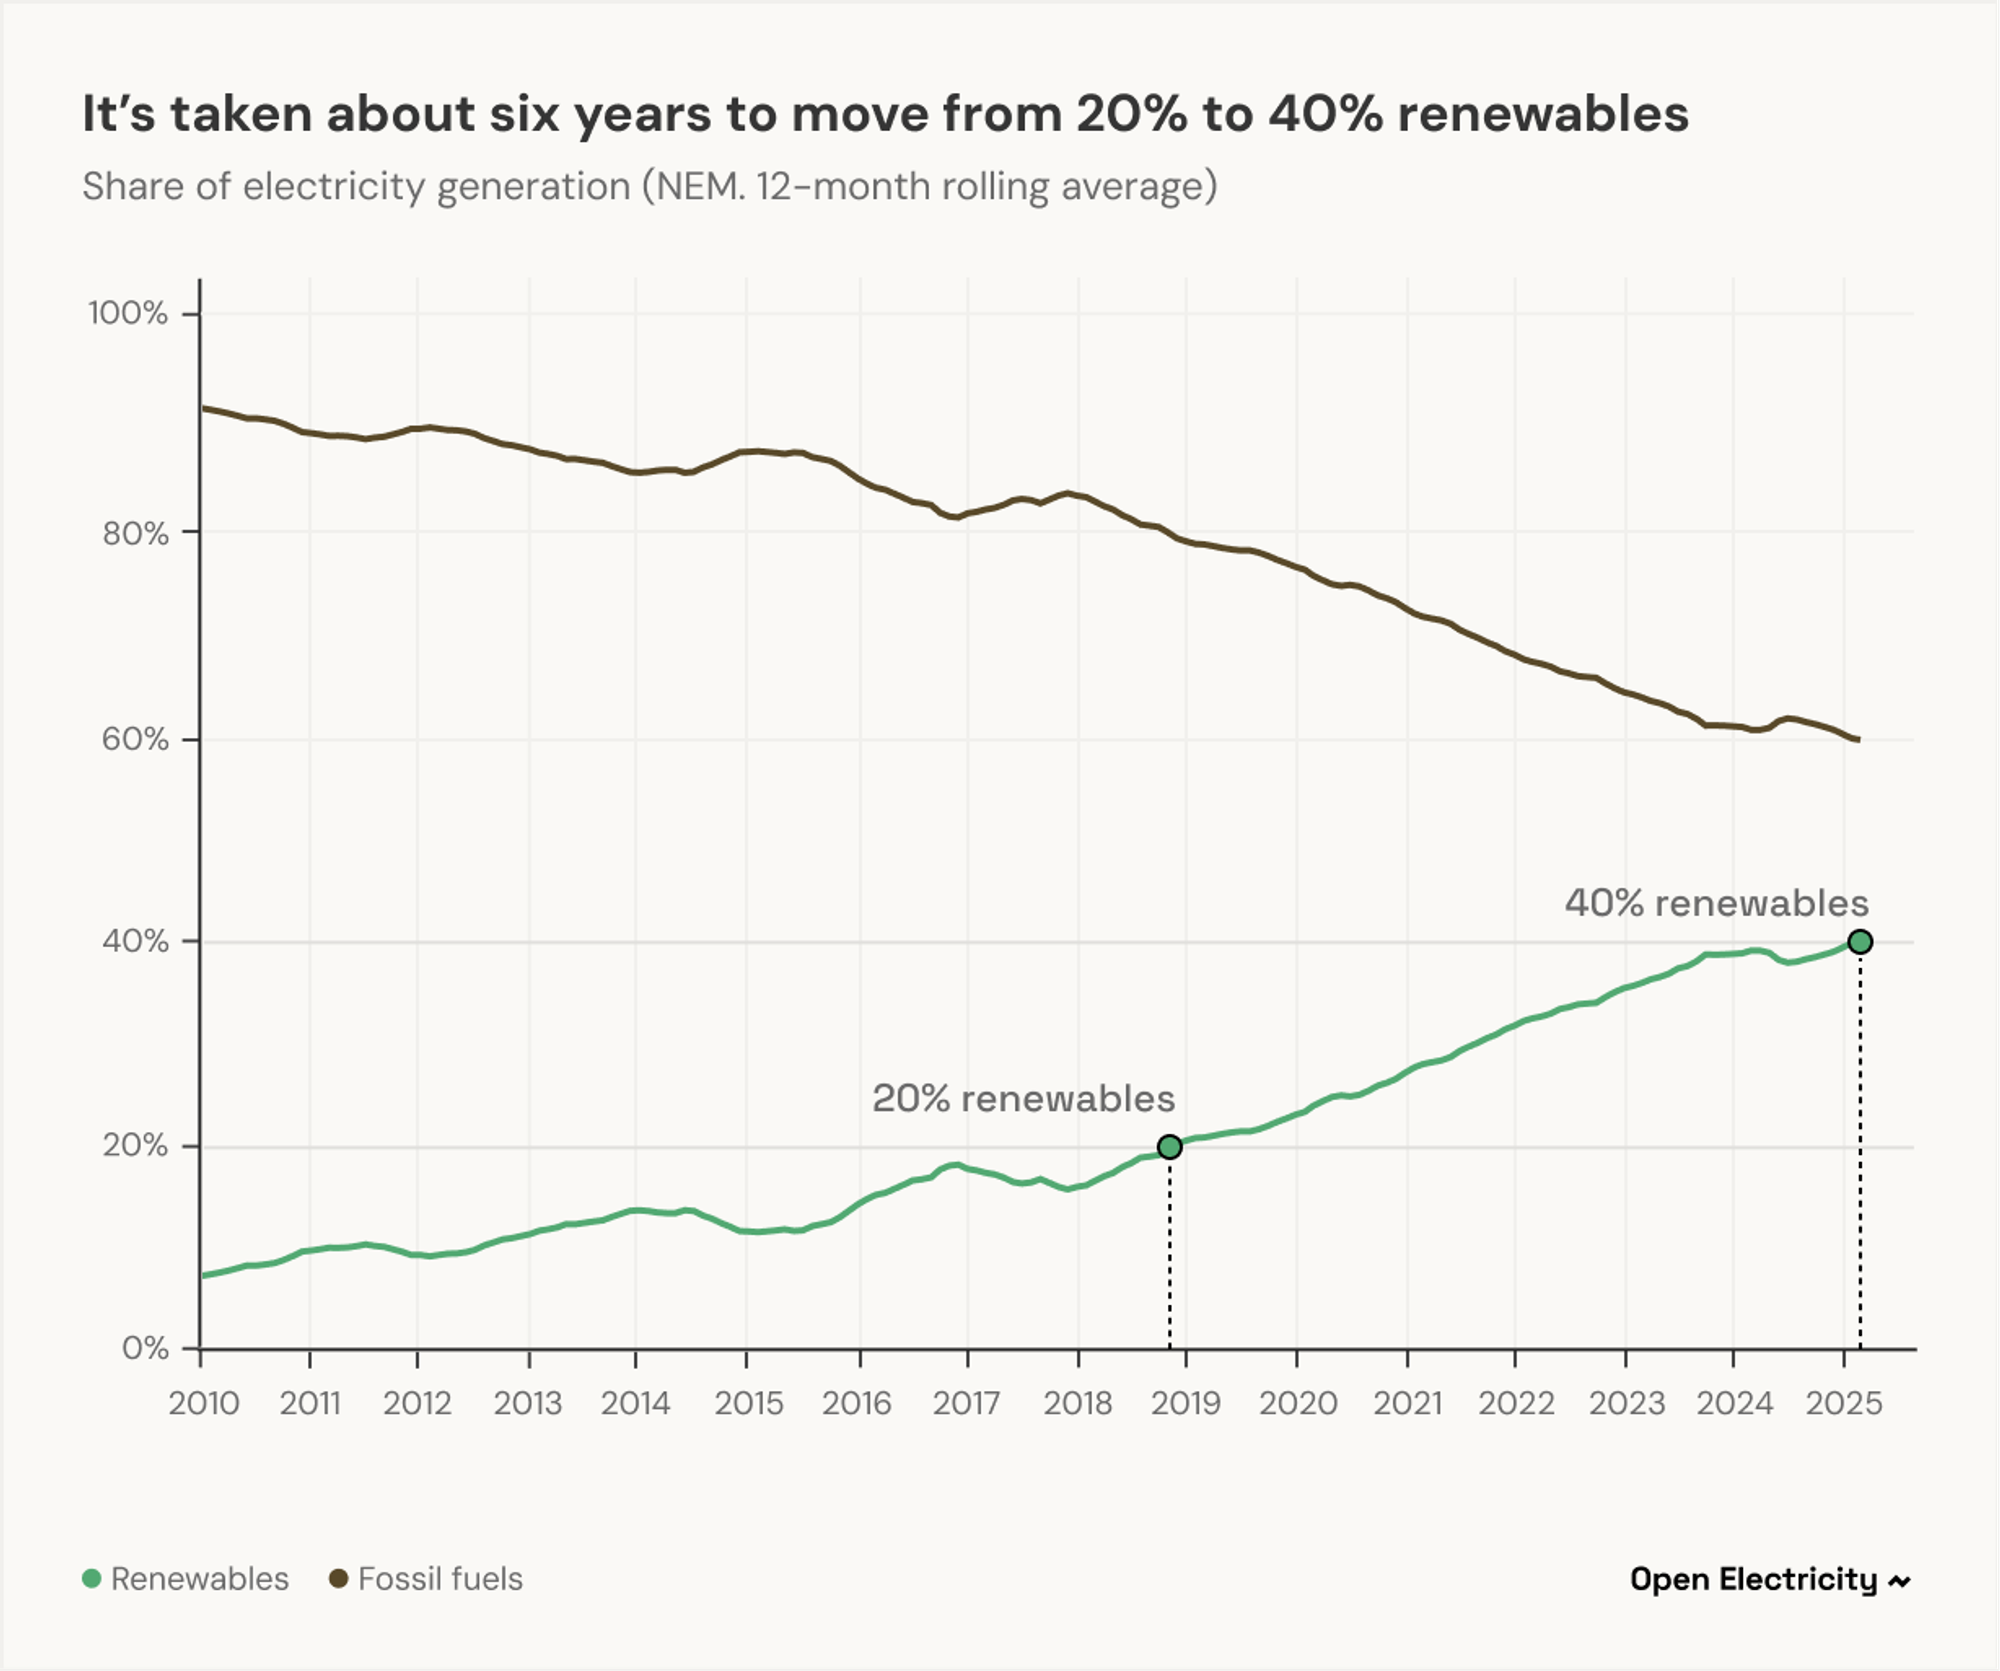
While round numbers like 40% don’t have any magical significance, they are useful waypoints along the market’s transition pathway. Open Electricity’s long-term rolling view of the supply mix shows that the 20% renewables level was reached back in December 2018 – a couple of years earlier than the “20% by 2020” renewables target set back in 2009 when the expanded Renewable Energy Target (RET) was introduced.
It’s taken just over six years to move from 20% to 40%, which is a good prompt to look at future growth rates in the transition pathway represented in AEMO’s current Integrated System Plan (ISP).
Open Electricity’s Scenarios Explorer provides access to a range of ISP projections, from both the 2022 and 2024 editions of that plan. Most commonly referenced is the 2024 Step Change scenario. So how do its numbers compare?
Aligning the Step Change scenario’s supply numbers for 2024 to the last 12 months shows that all forms of renewables (except hydro) are a little ahead of projection. Looking forward we can see an accelerating expansion projected to 2030, in parallel with a rapidly reducing coal share.
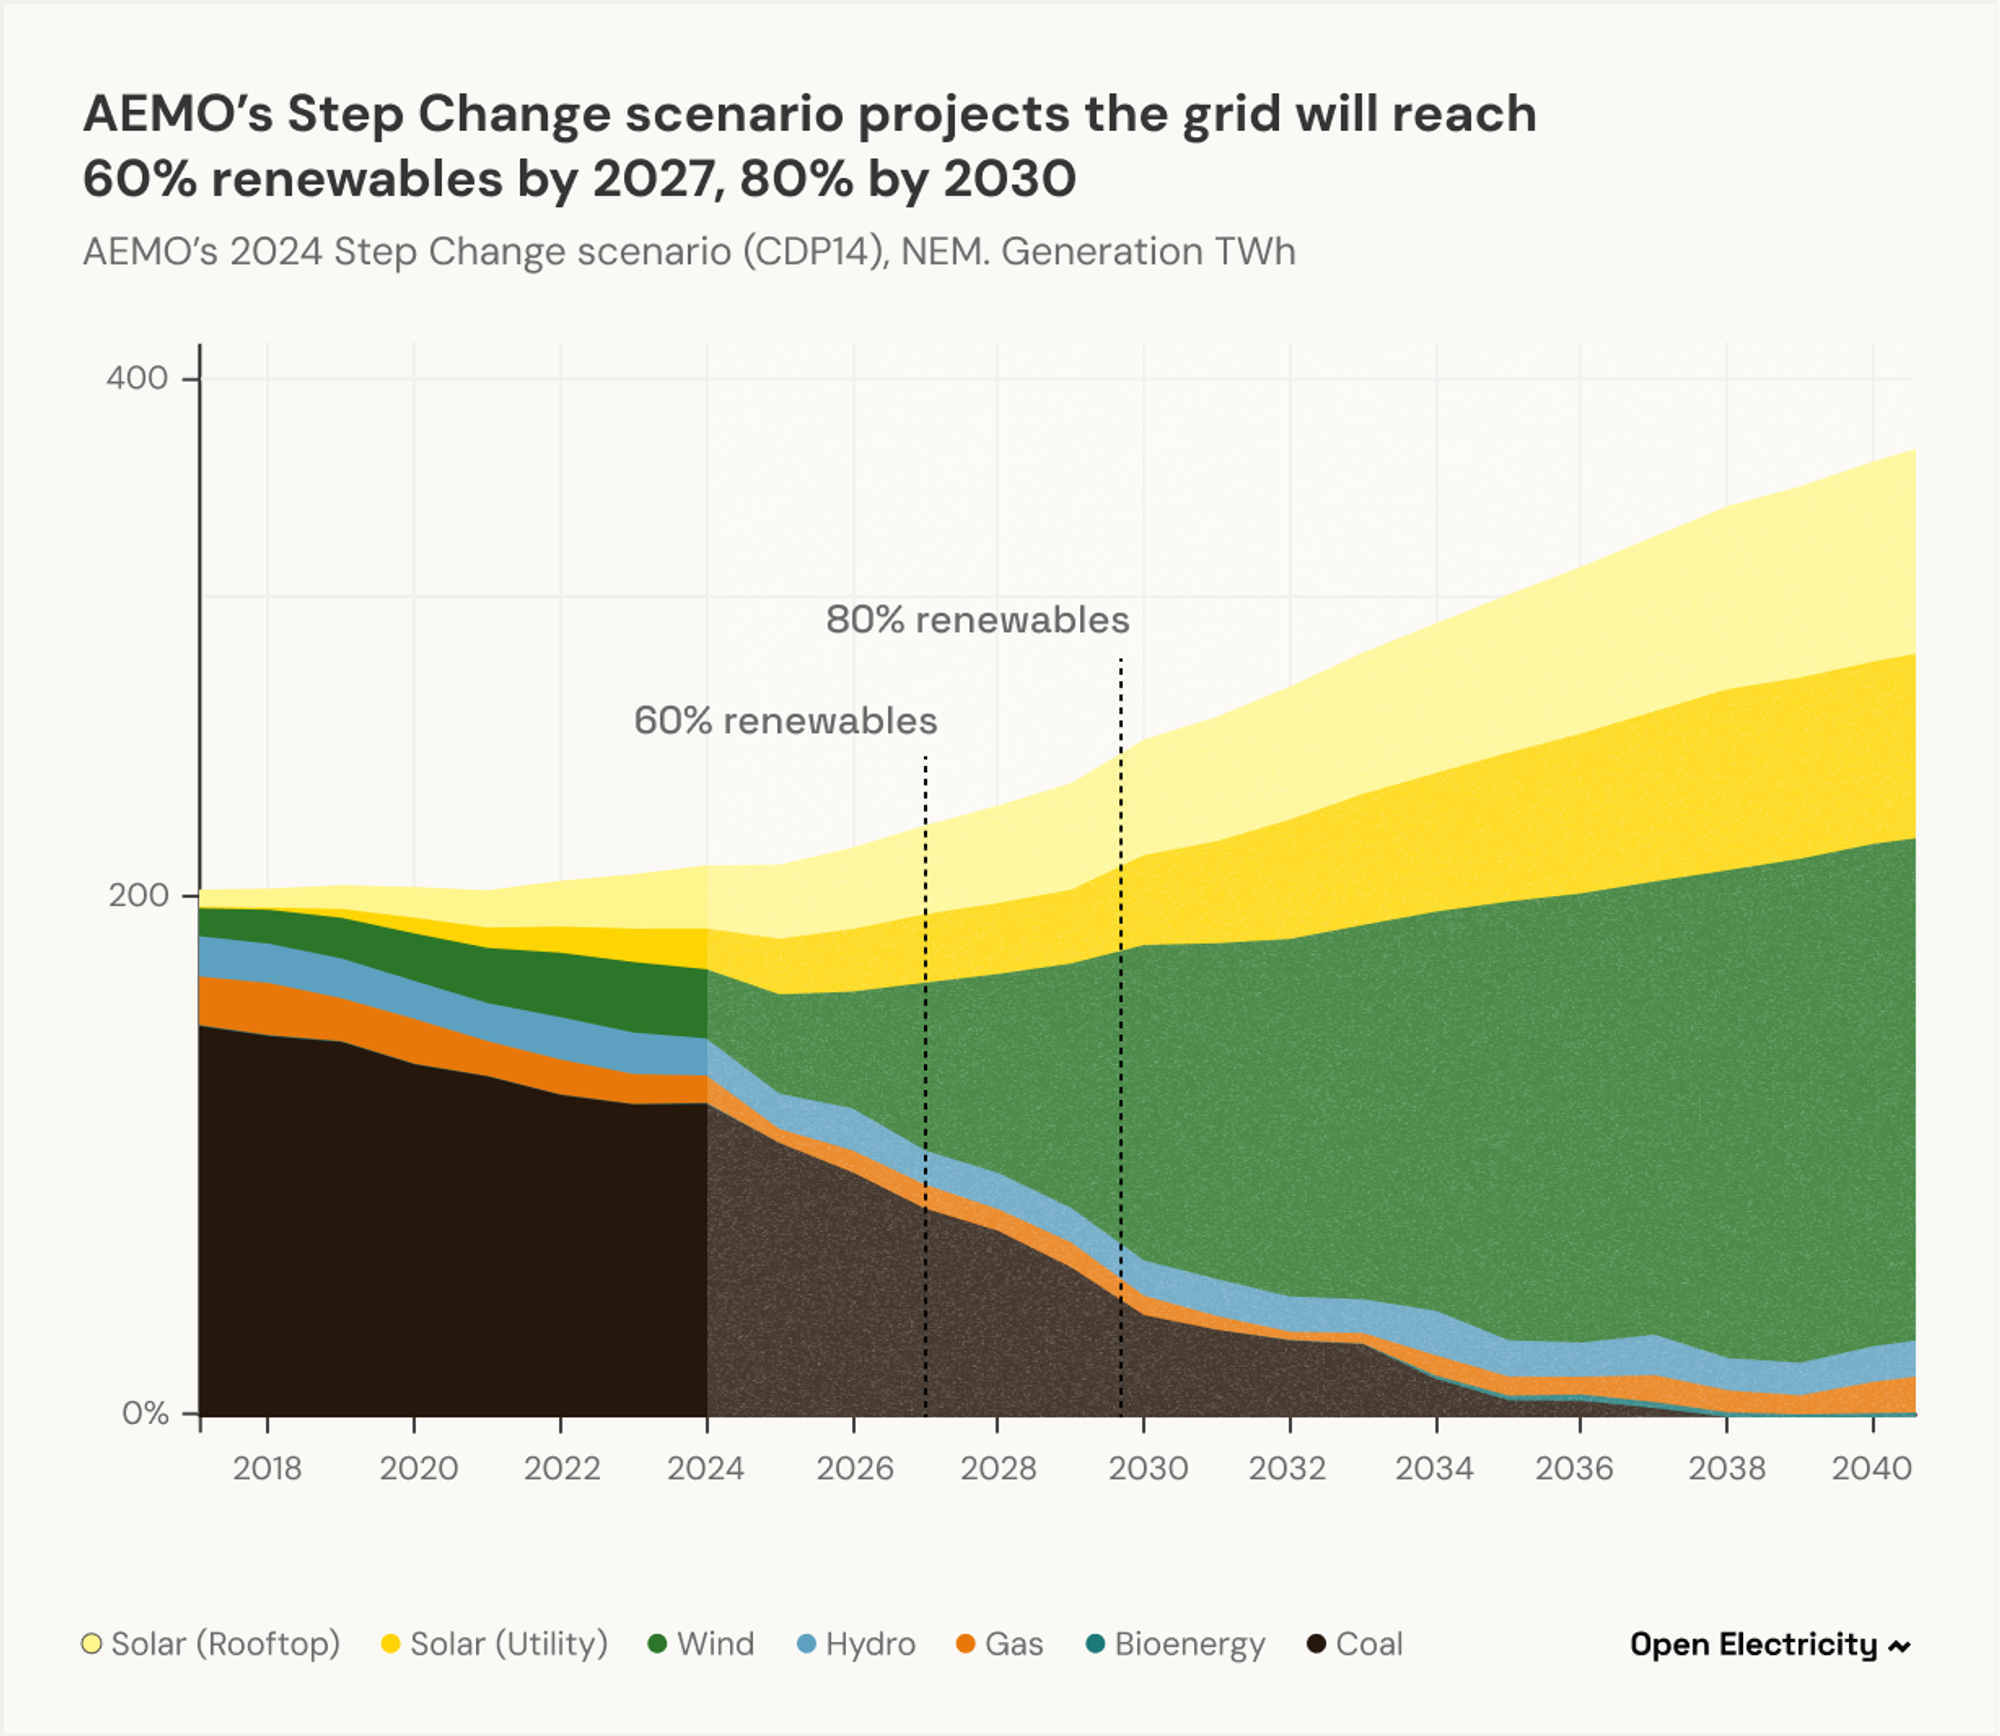
This scenario’s next 20% increment in renewables share is projected to occur by the end of 2027, with a further 20% increment before the end of 2030. These dates reinforce the acceleration in energy production growth that the ISP chart shows for all forms of renewables, particularly wind. By 2030 this scenario has NEM annual wind production quadrupling from its current levels of 30 TWh to 120 TWh.
Are we building enough to match these projections?
At the start of Q1 2025, the NEM had 11.2 GW of fully-commissioned operating windfarms, with another 2.3 GW of capacity online but still in the commissioning process and yet to produce full output. The ISP projections imply an expansion of this operating fleet by another 30 GW-odd by 2030, or around 5-6 GW of new wind capacity per year. A forward view of new capacity in the pipeline would be very helpful in assessing how the NEM is tracking towards this projection.
AEMO’s Connections Scorecard is a useful tool to assess the volume of new projects that have entered the formal grid connection process, once its categories for classifying the status of projects as they proceed through that pipeline are understood. Here’s AEMO’s most recent view of projects by status and technology type:
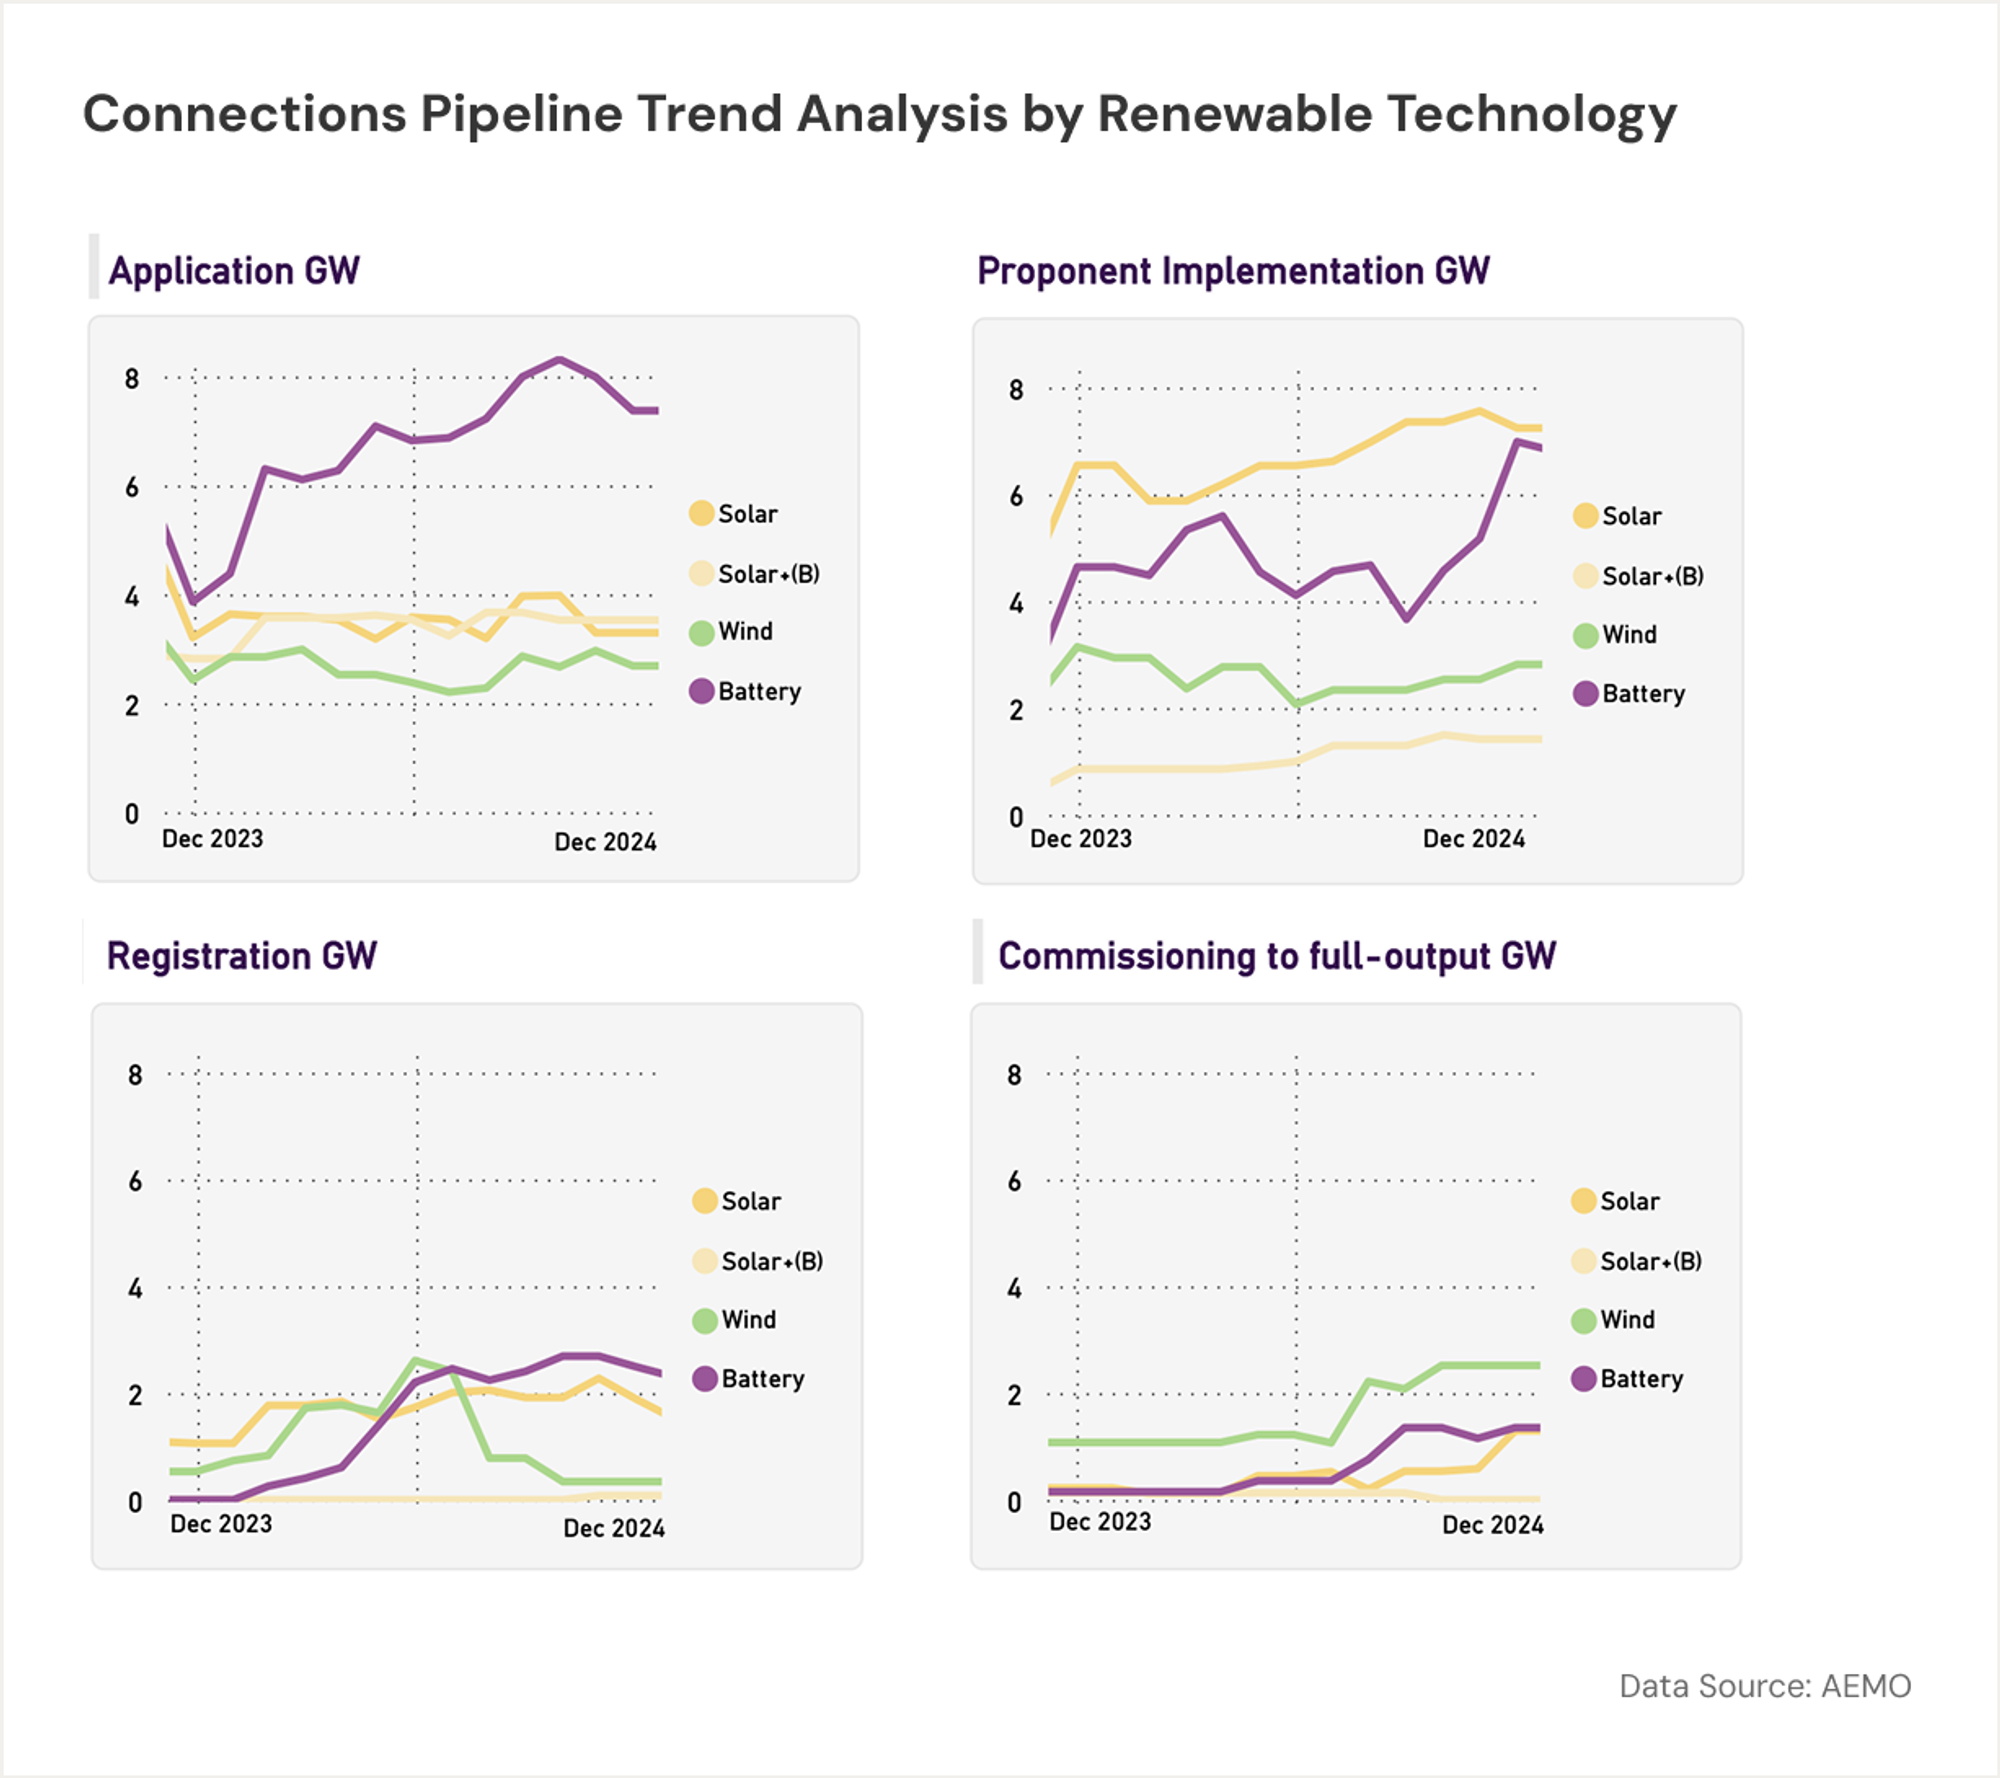
Simplified definitions of these status categories are:
Application – project designs have been submitted and are being assessed by AEMO and relevant network companies for compliance with connection requirements
Proponent Implementation – project proceeding through contracting, financing and physical construction
Registration – project ready for grid connection, with the technical compliance of as-built plant being assessed before registration to operate on the system is approved
Commissioning – project registered and connected to the NEM but proceeding through progressive hold points and testing protocols towards full output.
The last category covers the 2.3 GW of in-commissioning wind capacity mentioned a few paragraphs earlier, which are already providing some output to the system. The first three categories cover projects that have at least reached the application stage (design technical assessment). There we can see something like 6 GW of wind projects, most of this capacity split equally between the Application and Proponent Implementation categories, but a much higher volume of large scale solar and battery projects (around 34 GW) formally in the connection pipeline.
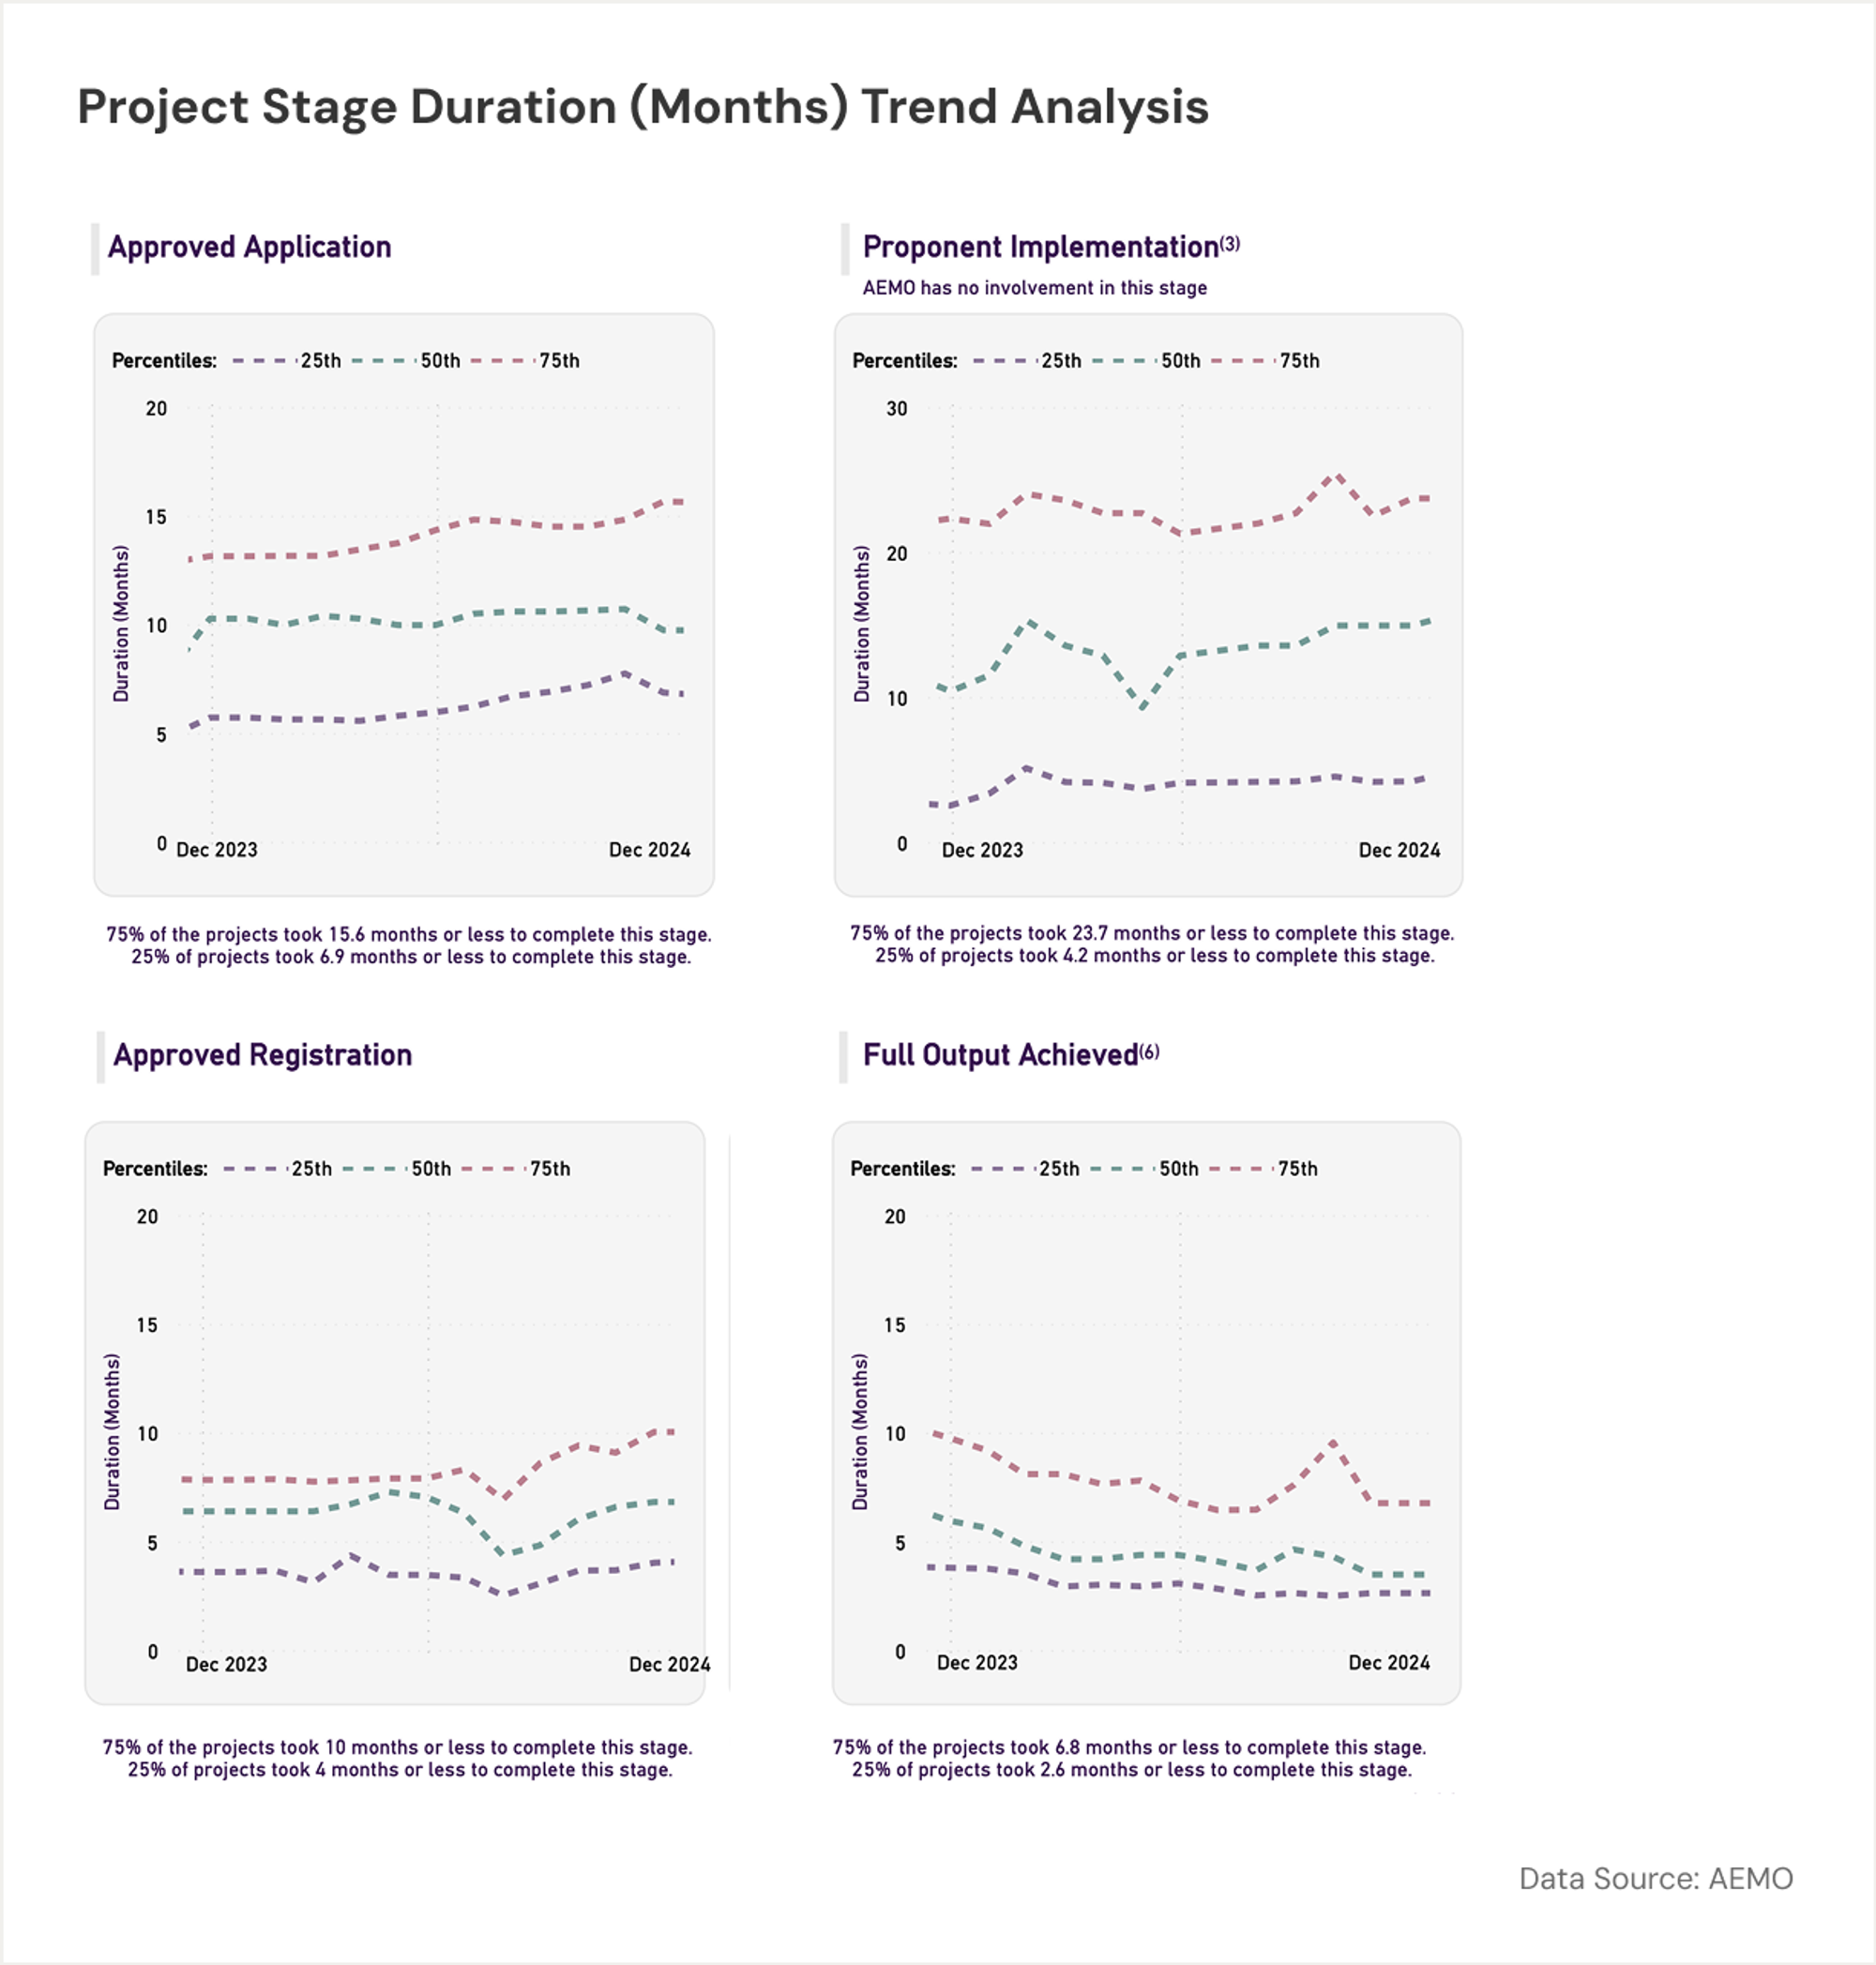
Timeframes spent within each stage of the connection process can vary significantly, but median durations shown in the Scorecard suggest that it takes something approaching three years for the typical project to move from Application for connection through to being fully commissioned.
Overall this data shows that wind isn't coming onto the system as fast as the ISP projects over the next couple of years. Even if all the wind projects now in the pipeline reach fully commissioned status by the end of 2026, this will still be short of the 5-6 GW per year rate implied by the Step Change scenario.
On the other hand, large scale solar and solar+battery projects in that pipeline appear to be tracking well ahead of the near-term rates implied by the ISP, with around 18 GW in the connection pipeline but not yet online. As with any forecast, projecting totals is difficult enough, while predicting the balance between different types of project is even more fraught.
And of course there are many more renewable projects at earlier stages of development but not yet part of the formal connection pipeline. This would include a number of the projects successful in obtaining financial support via one of the state or federal capacity investment schemes – meaning that there are certainly more wind projects amongst those likely to appear in AEMO’s connection pipeline in coming quarters.
Tracking the progress of projects through this pipeline into increases in renewable generation visible in OE’s tracking views of the NEM will be of keen interest over the next few years.
A closer look at batteries
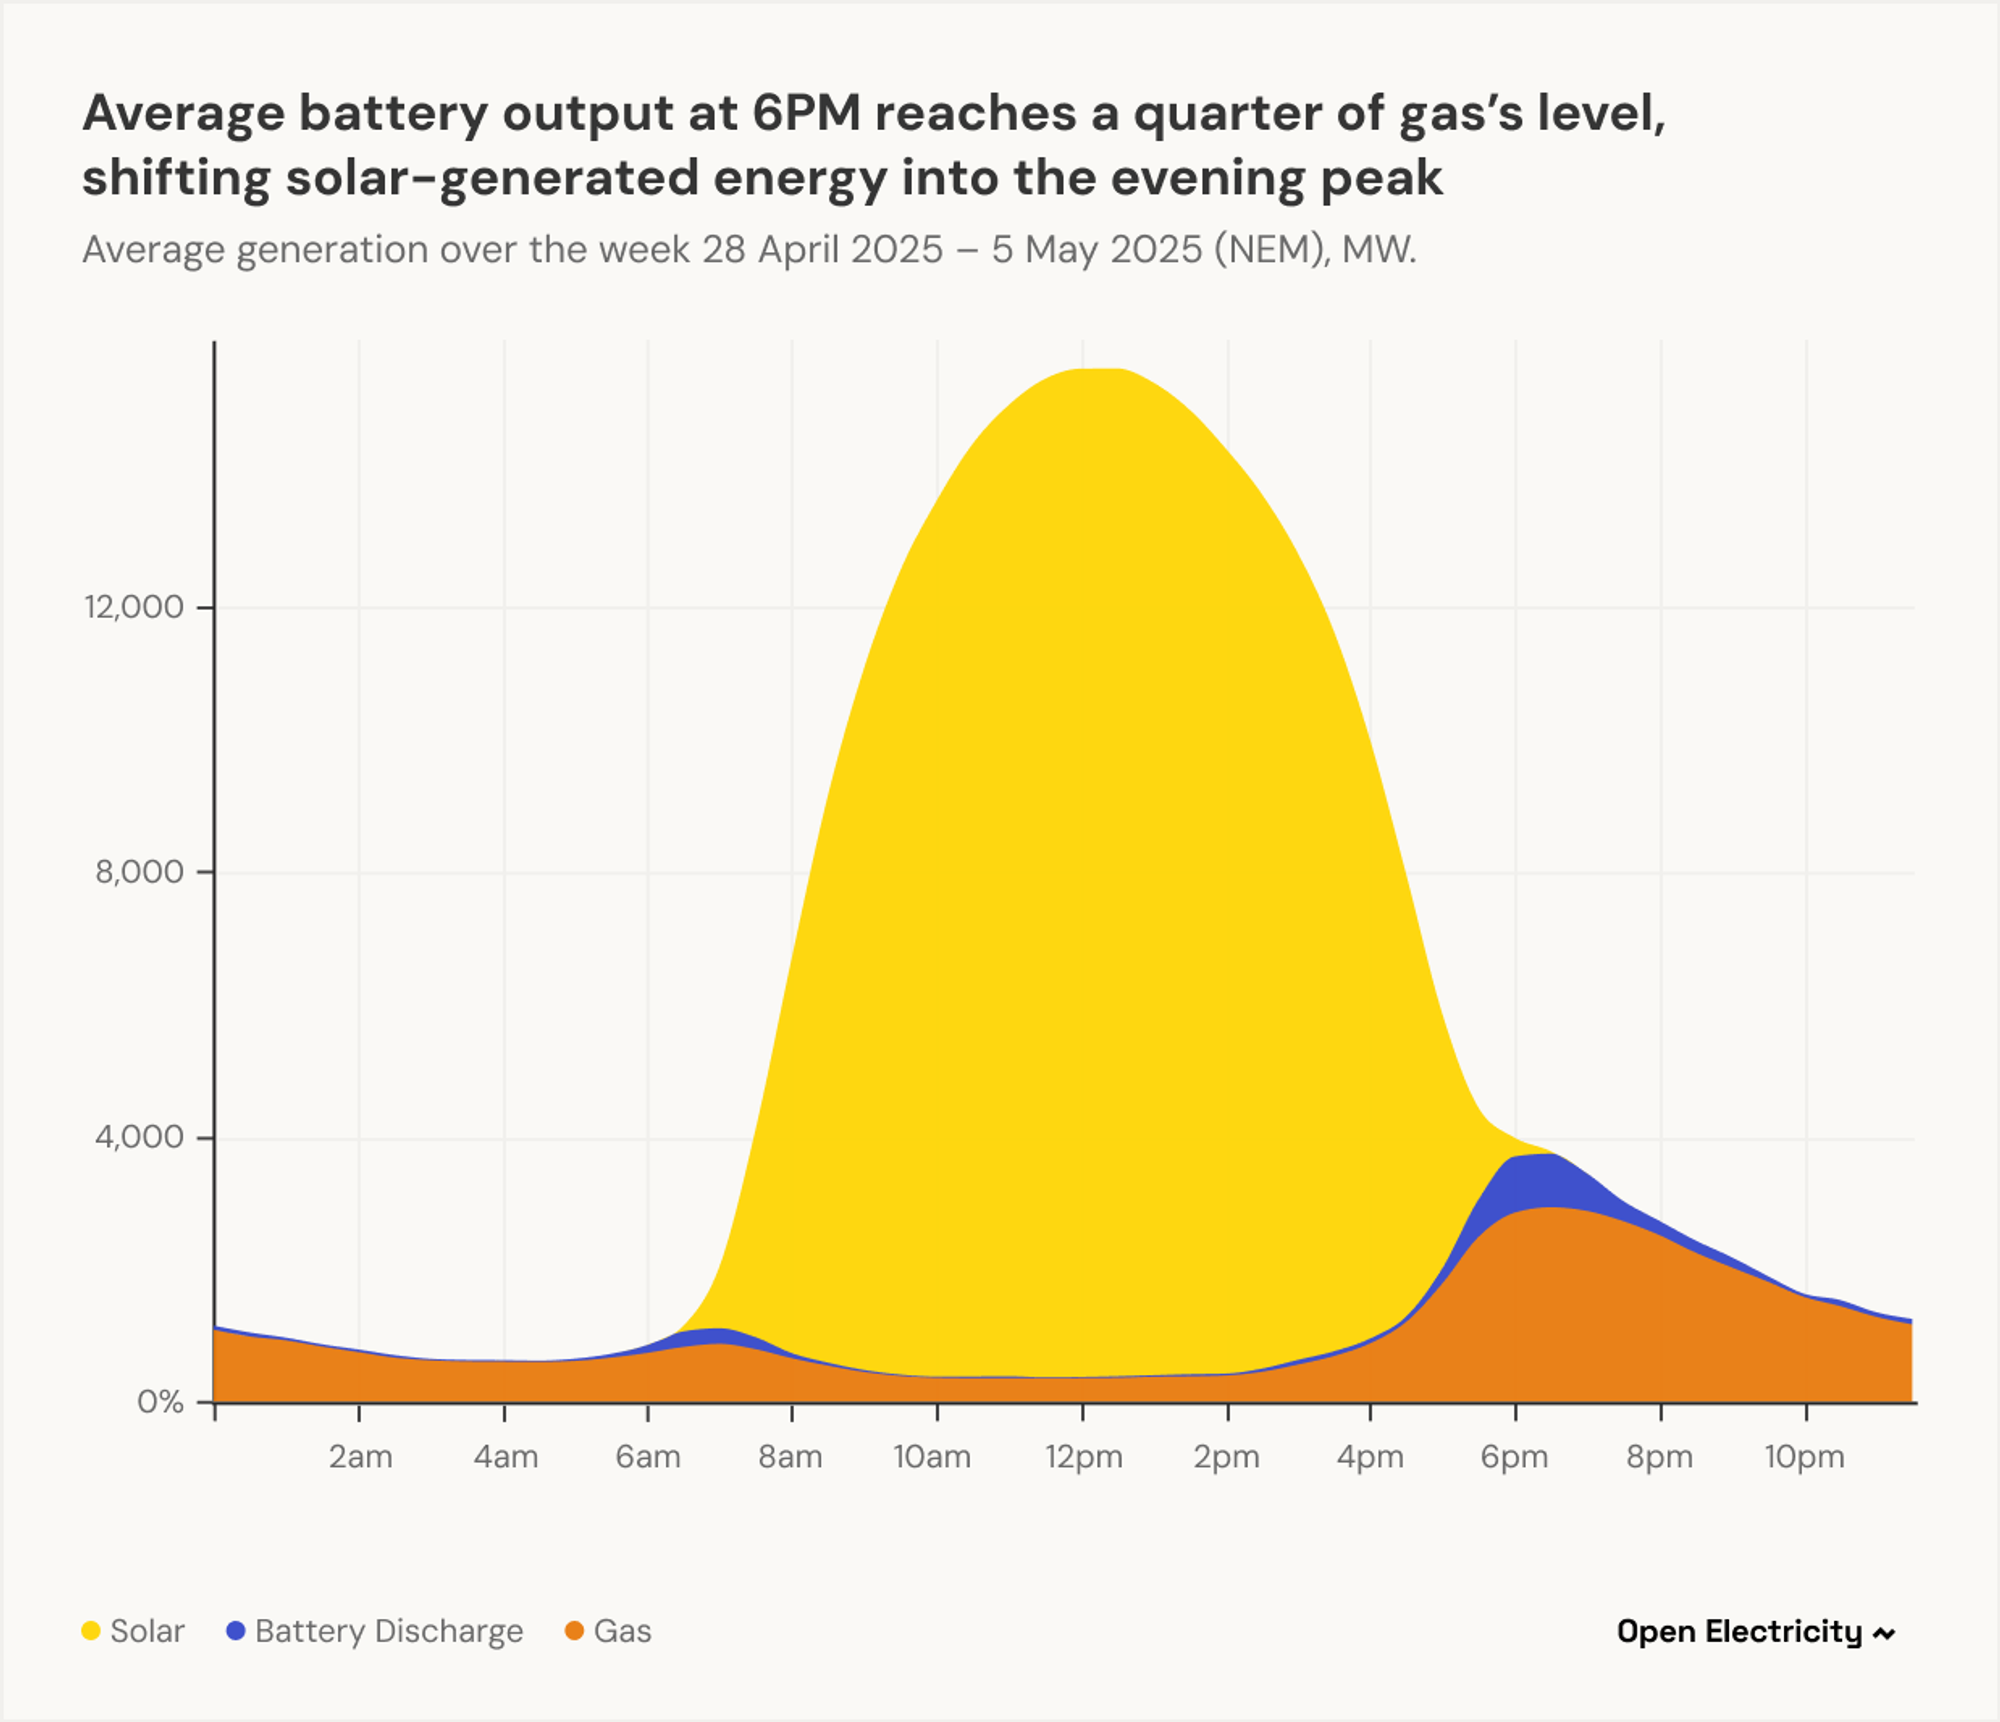
With solar growing faster than wind in the short term, grid-scale batteries will have to do more heavy lifting. Solar output is inherently concentrated in the daylight hours, and daily time-shifting of solar-produced energy into evening and morning periods, particularly to meet system peak loads, will almost certainly become the principal use-case for the NEM’s growing battery fleet. So how are batteries performing?
Since daily profiles are the key here, OE’s time-of-day views showing average outputs by technology for recent periods are the most instructive. At first glance battery generation seems small, but its recent average output near the evening peak (over 700 MW at 6pm) has already reached more than a quarter of the average supply from gas fired generation at that time.
OE also provides a drilldown into the underlying daily profiles (accessible on the same page). Here it’s interesting to compare recent daily generation profiles for batteries with open cycle gas turbines which are their most direct analogue for peaking supply (note there’s a difference in vertical scales here)
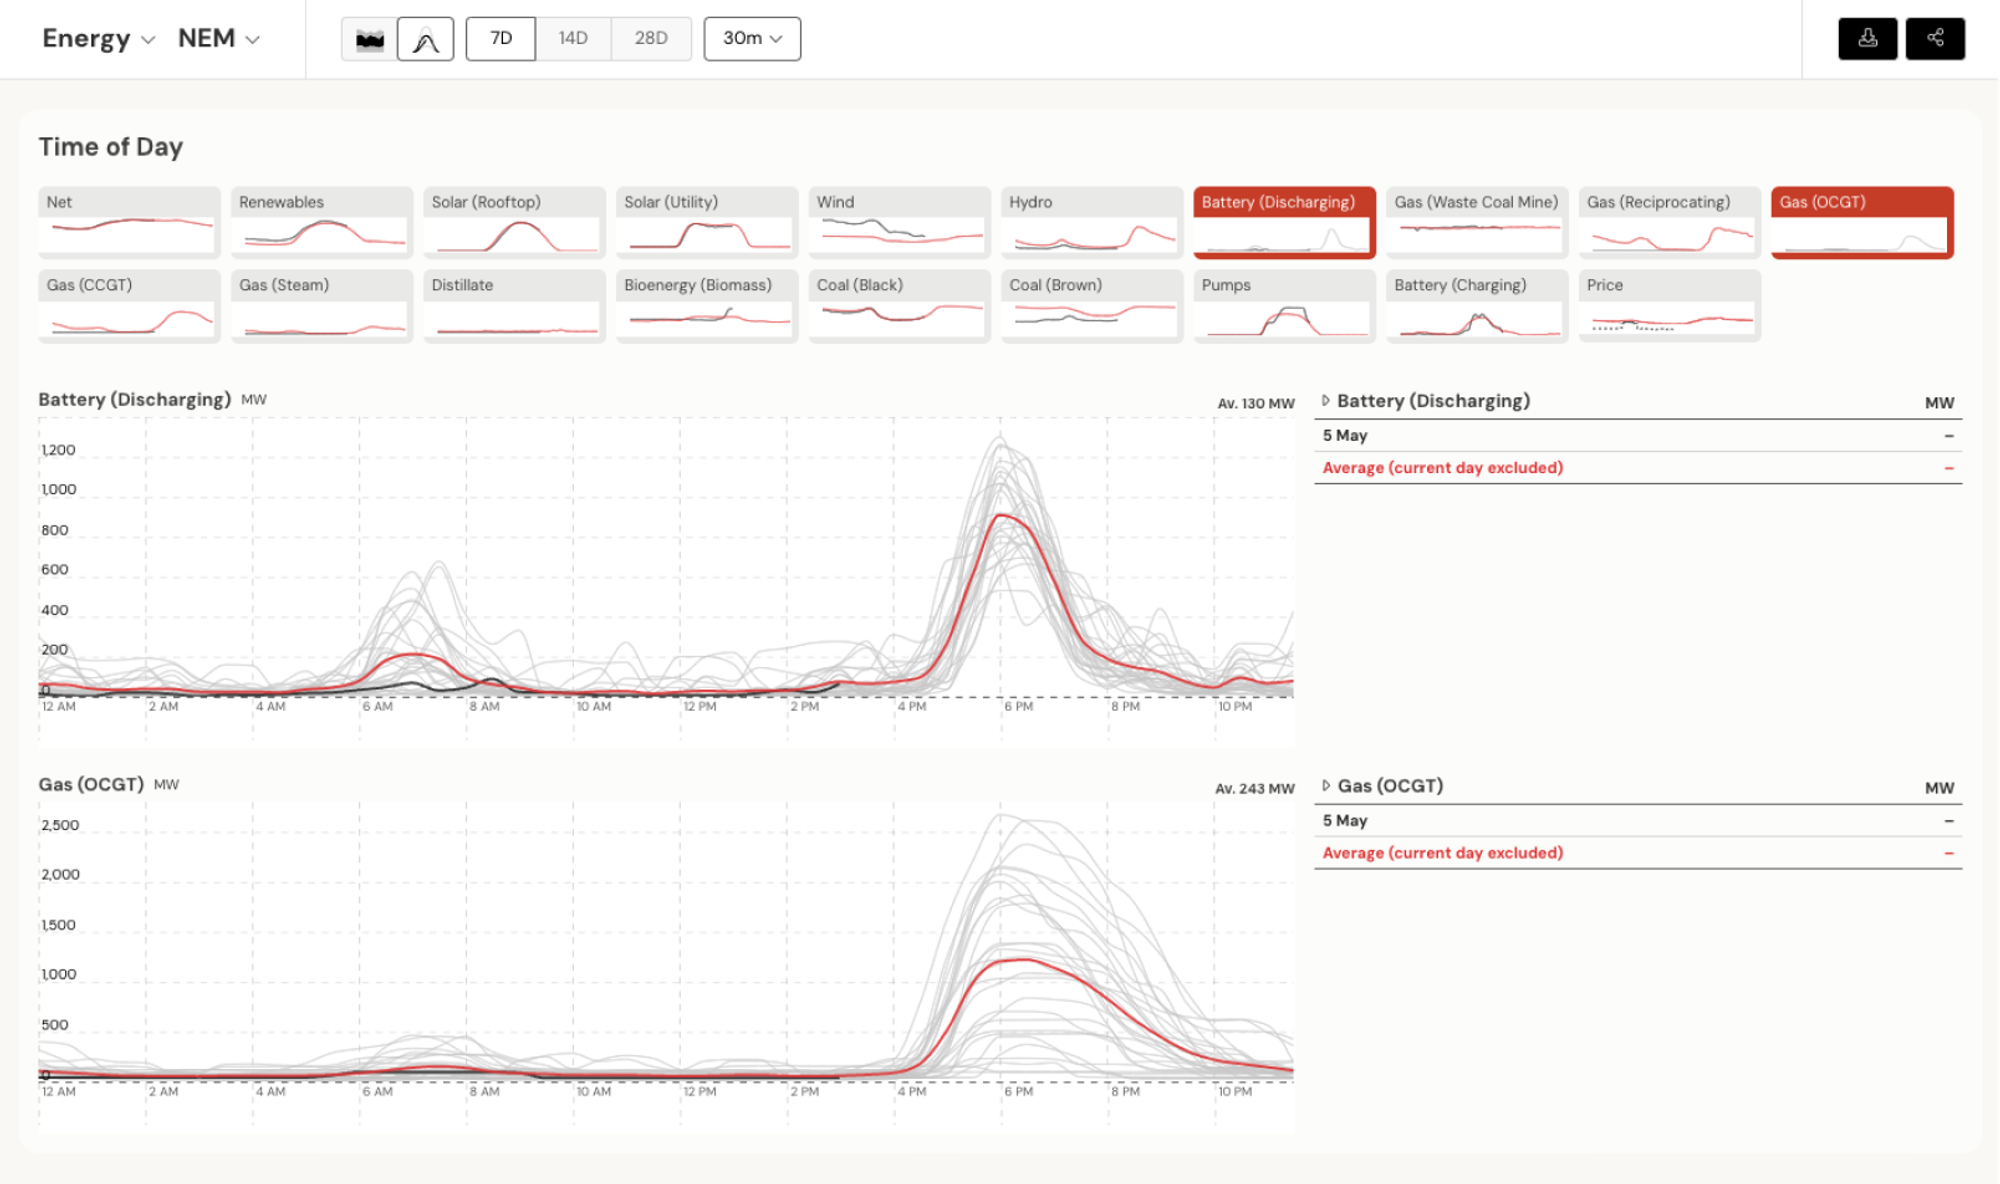
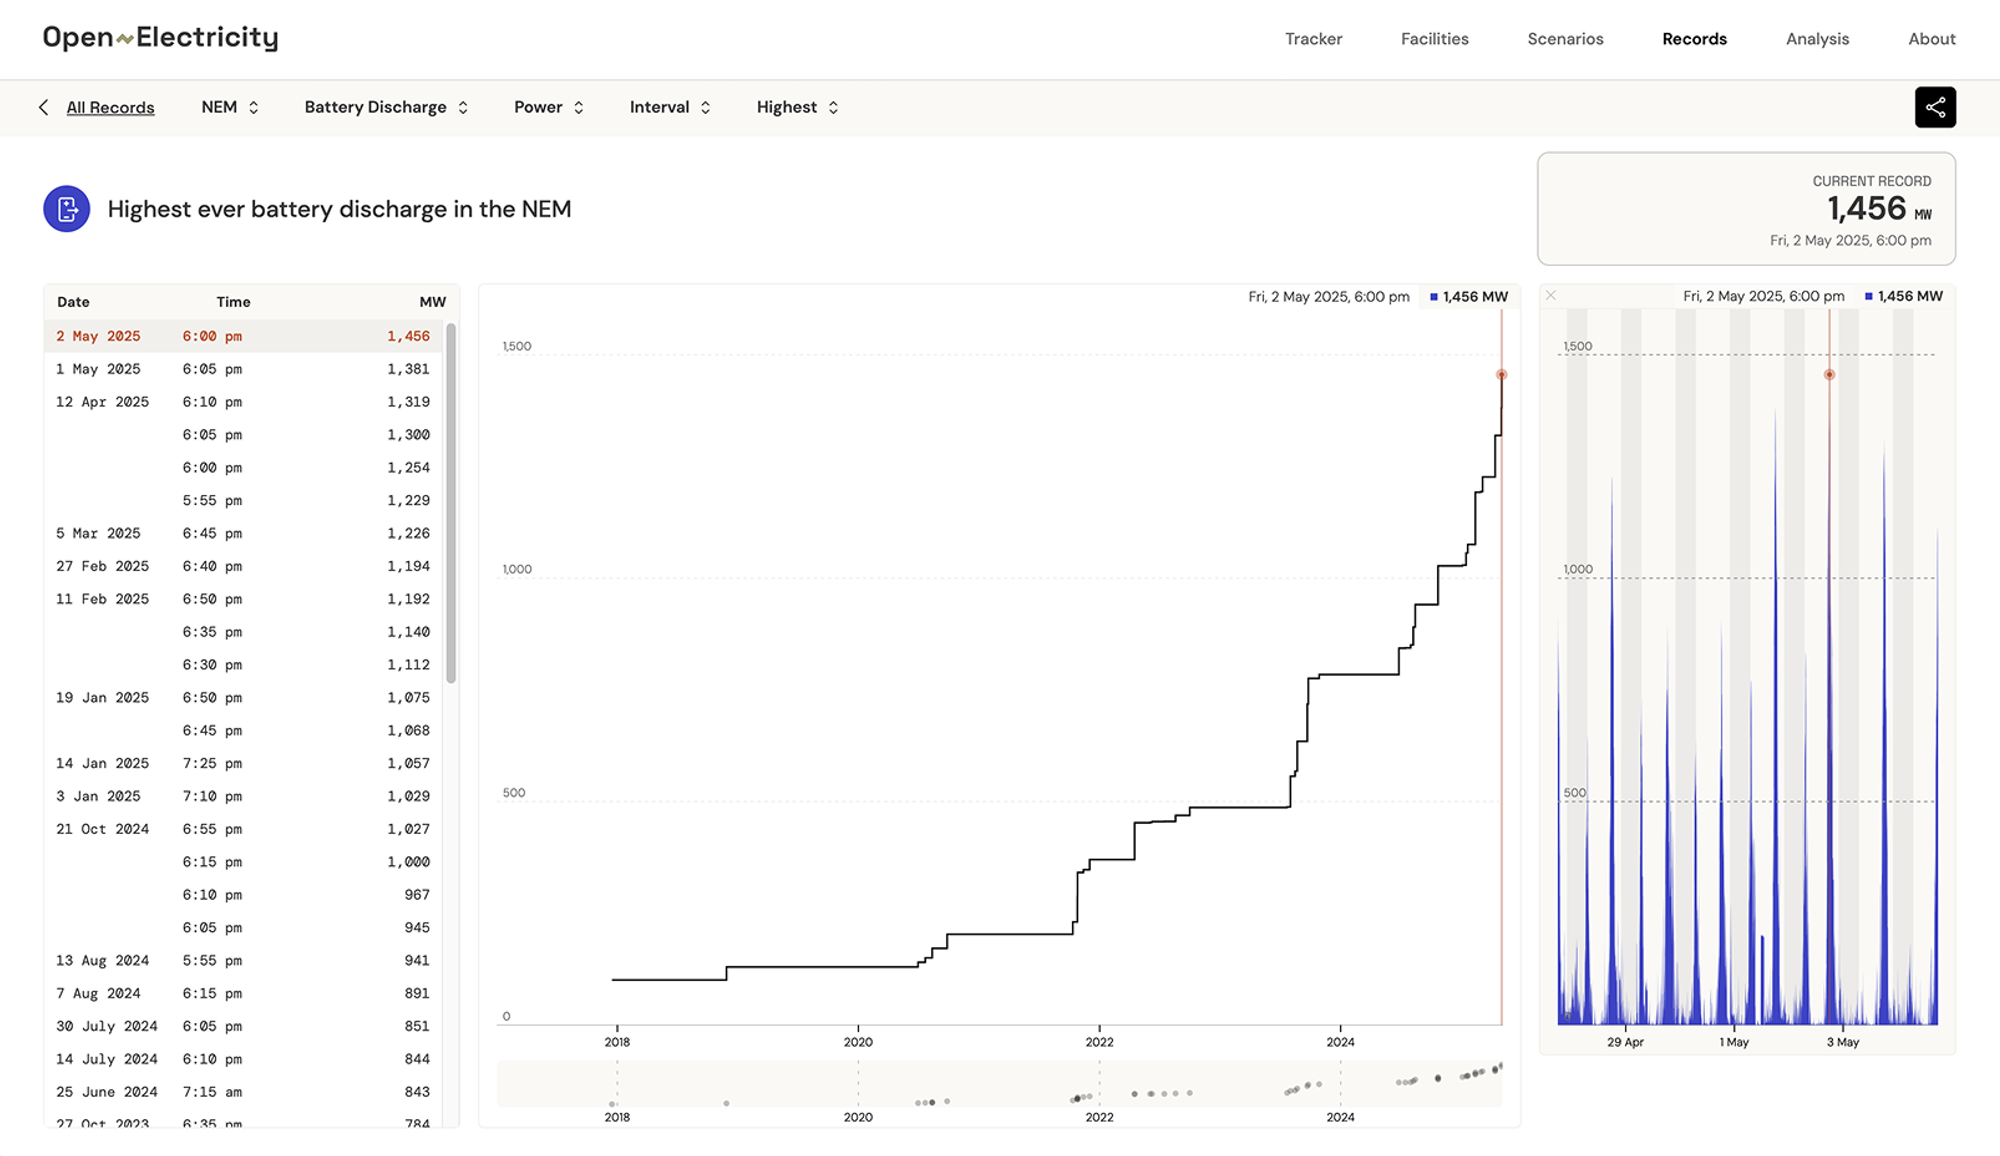
Aside from the very obvious similarities in generation profiles, we see that the highest half-hourly output from batteries in the last 28 days charted, 1,300 MW, is approaching half that from gas turbines, 2,673 MW. OE’s recently launched Records page provides a great historical perspective on the evolution of peaks like these (note that the Records page shows peak 5-minute output, which can be higher than the half-hourly measure mentioned above).
Given the volume of battery and solar capacity in the pipeline, following metrics like this one through Open Electricity will be another key indicator of how the transition is tracking.
In summary, recent data confirms steady advancement along the NEM’s transition pathway, with varying rates of progress for key technologies ahead of a period of projected acceleration. As the pipeline evolves, watching how they translate into real-world outcomes – visible in tools like Open Electricity – will make for fascinating viewing.
This article is available for republishing under a Creative Commons CC BY-ND 4.0 licence. Please credit the author and Open Electricity, include a link to the original. Edits allowed only with explicit permission from the author.