Balancing the system: The evolving role of gas in the NEM

Reality Check is a quarterly series by energy analyst Allan O’Neil, offering a clear-eyed look at how Australia’s electricity system is really tracking – using fresh data, grounded analysis and Open Electricity’s system-wide tools.

It’s clear enough that the NEM is transitioning irreversibly away from its historic reliance on coal-fired energy, for multiple reasons: environmental, economic, and plain old age. While there are uncertainties about the precise timing, the direction of travel is unambiguous. But what about the NEM’s other fossil fuel?
Gas-fired generation in the NEM totals around 12GW of operational capacity, as listed in Open Electricity’s Facilities view (and also in a soon-to-launch capacity charts feature in the Tracker – watch this space!).
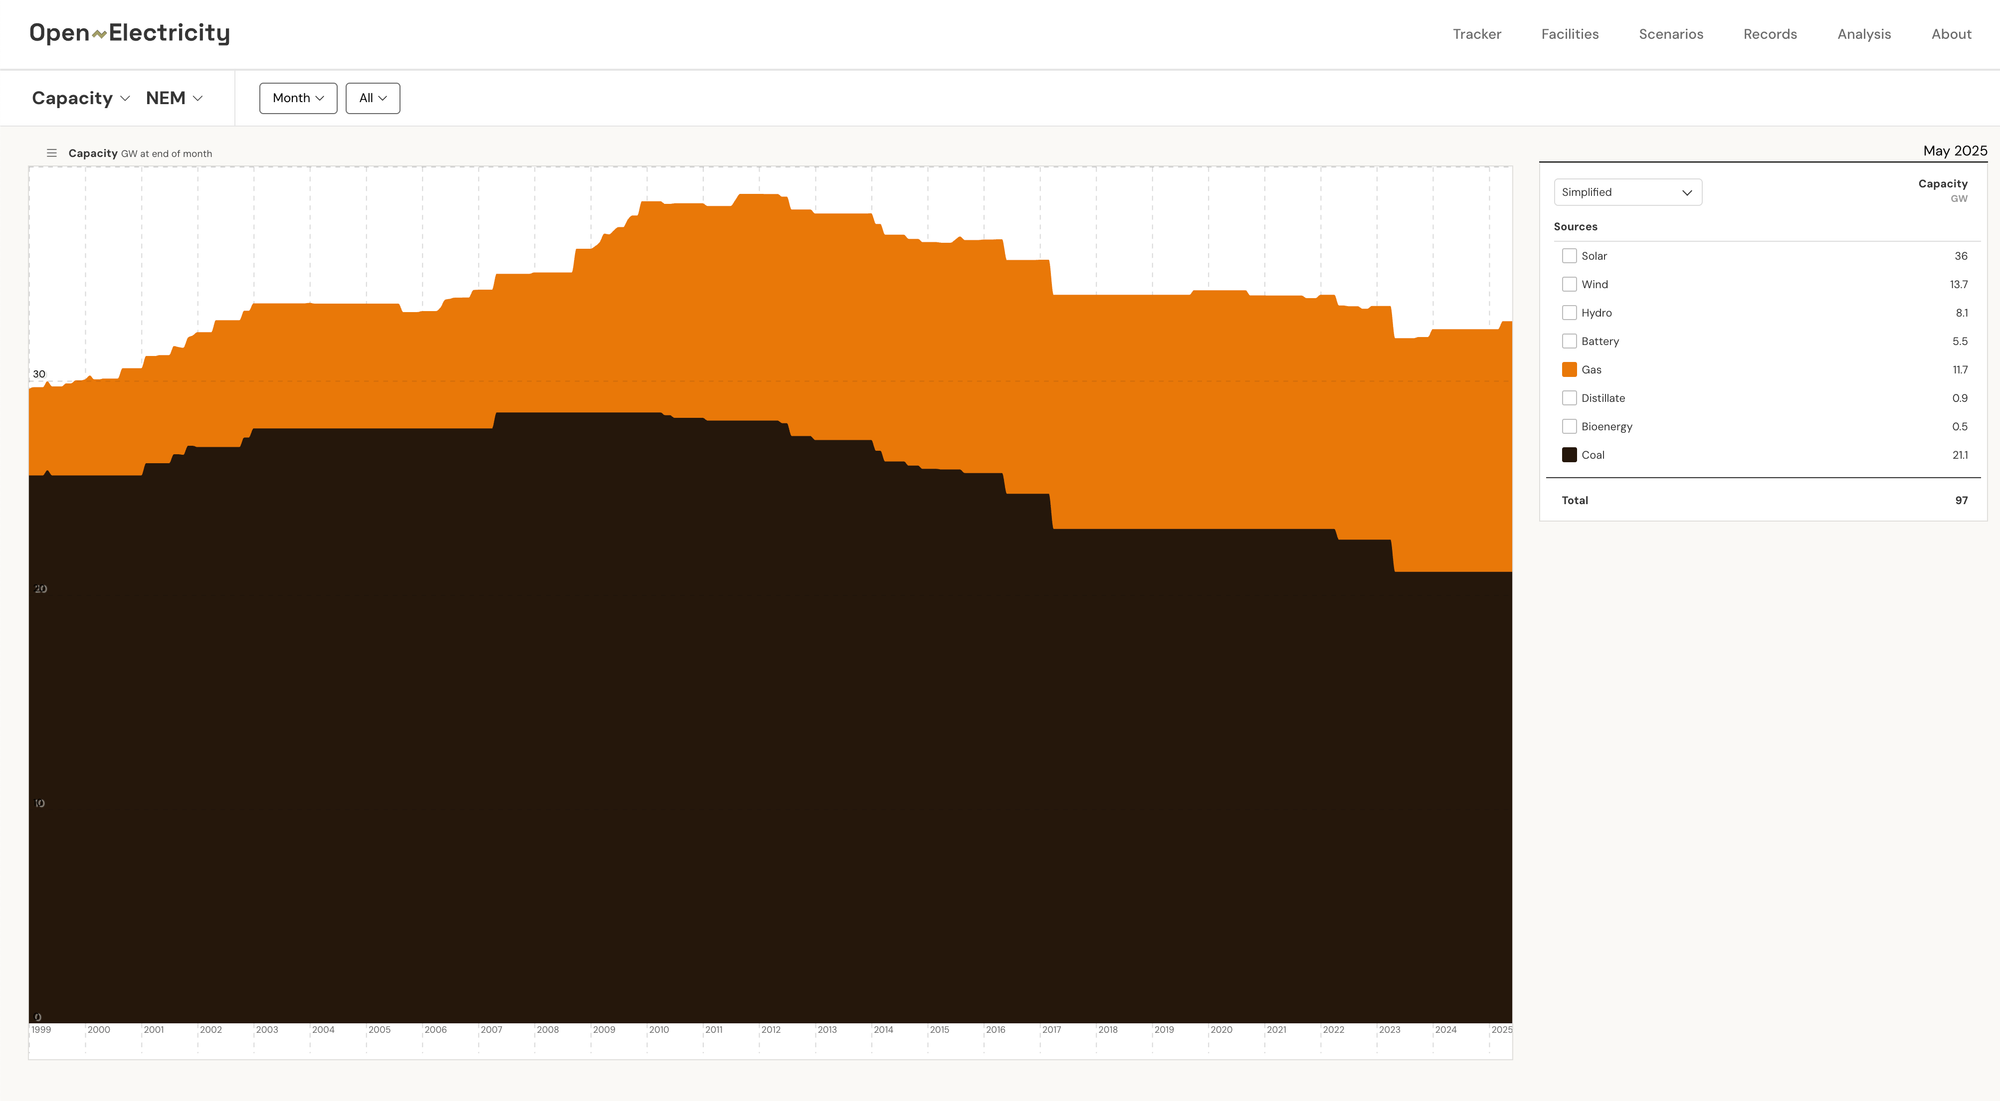
That’s roughly 60% of the operating capacity of NEM coal-fired generation. But while coal’s ultimate fate seems clear enough to most observers, the role of gas-fired generation in the transition appears less clearly understood – and more contentious.
This may seem surprising since gas presently fuels less than 5% of energy generated in the NEM, compared with coal’s share of over 50%. Both have been on downward trends as renewables grow, shown in this rolling 12-month view from Open Electricity’s NEM Tracker.
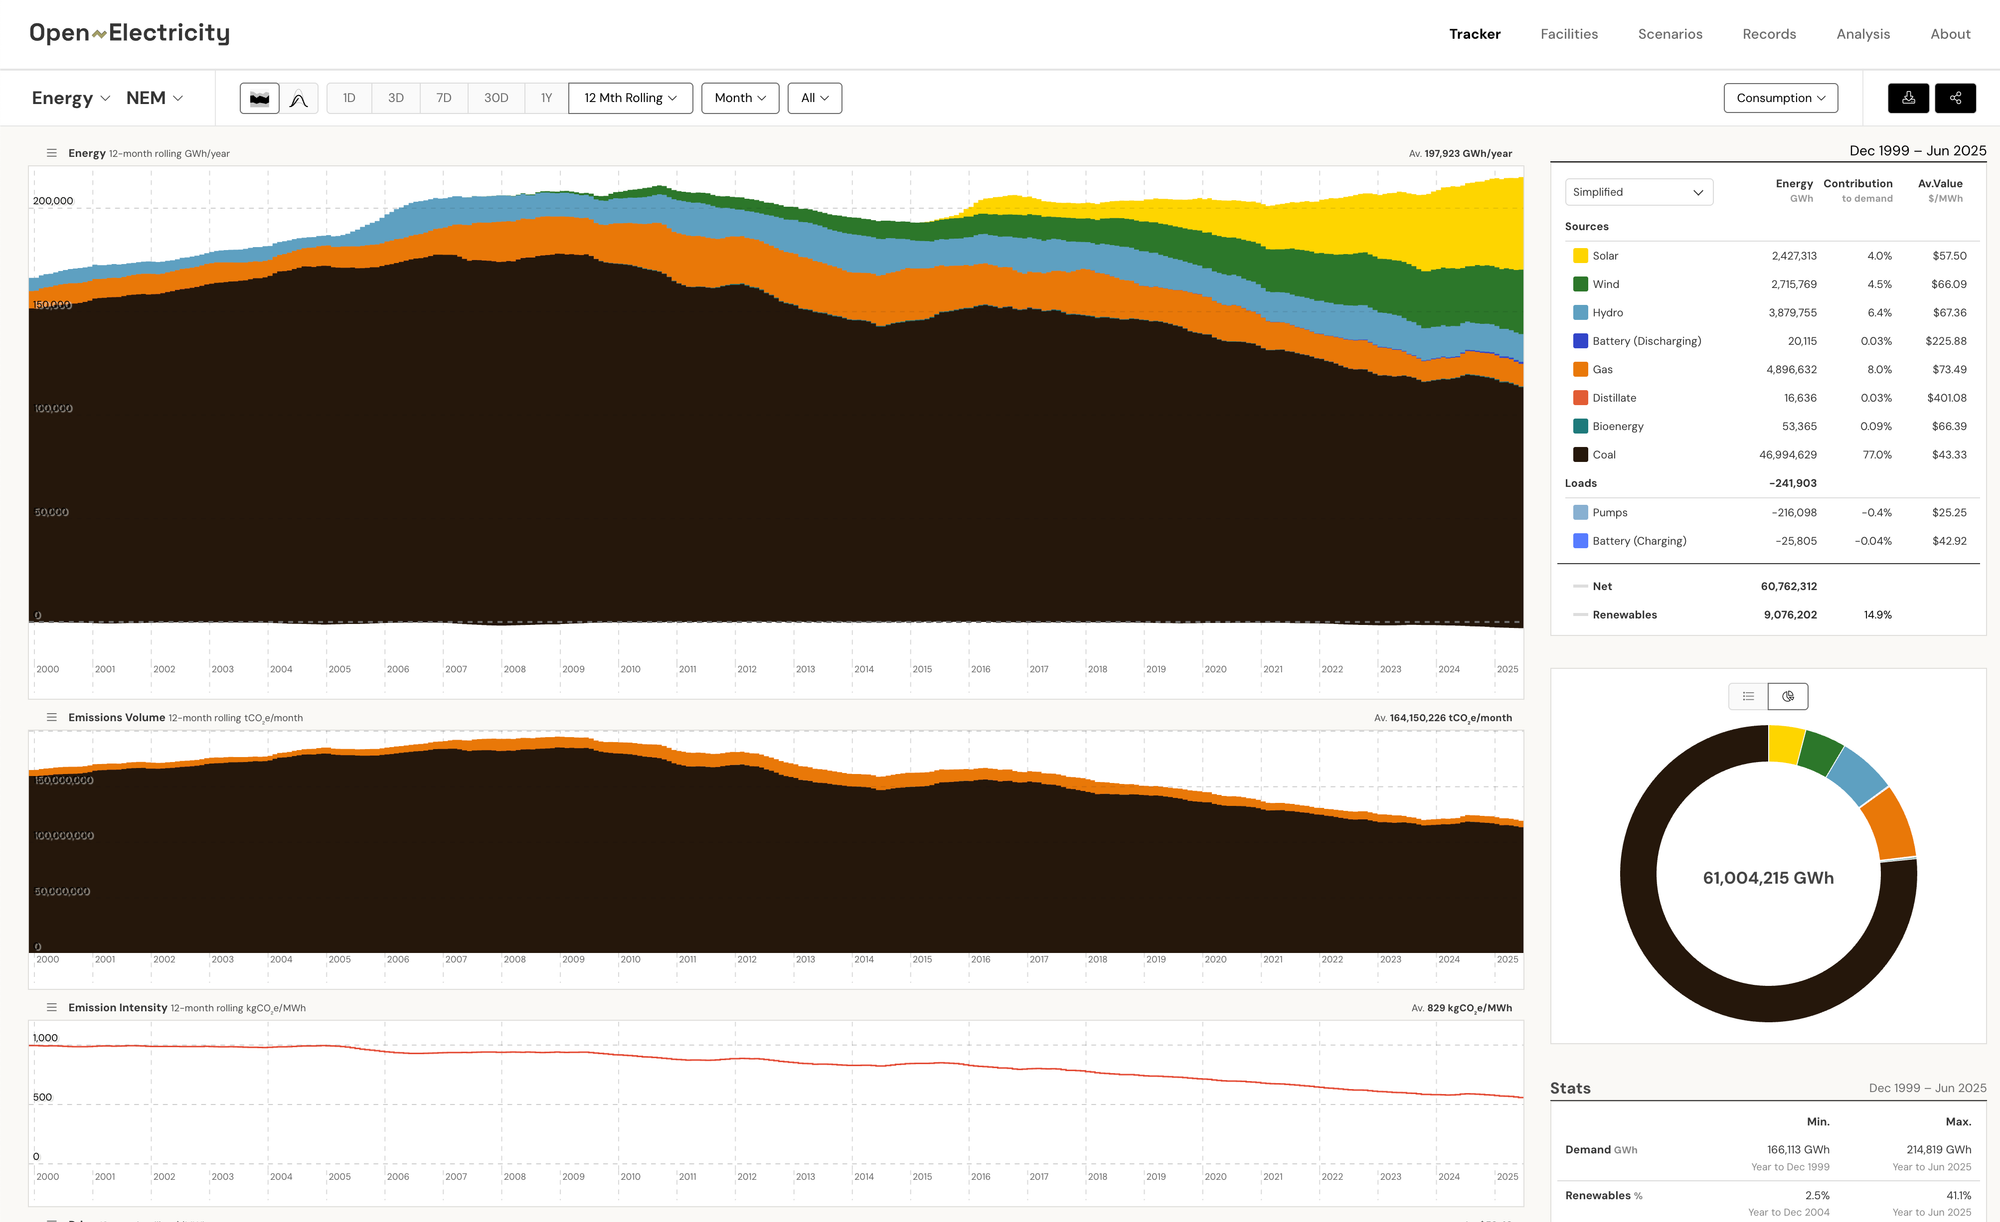
If renewable sources are going to replace all that coal-fired energy, then accounting for gas’s much smaller share ought to be dead easy, right? Why would phasing out gas-fired generation be any more difficult than the shift away from coal?
Energy Ain't Capacity
The reason it’s not that simple is the power system’s inherent need for dispatchable capacity in addition to energy – and other electrical services like voltage and frequency control or system strength (which I won’t focus on here).
At all times, the grid needs enough capacity online to meet whatever level of demand turns up. The second-to-second rate of supply (measured in units like megawatts, MW) has to balance the rate of consumption. That achieved, the laws of arithmetic mean that the quantity of energy supplied over any period (measured in units like megawatt-hours, MWh) will necessarily equal energy consumed, including losses.
It’s important to understand that the reverse is not true: simply having access to enough energy over a given period won’t keep the lights on by itself. That energy must also be delivered precisely when it’s needed.
Dispatchability and Unbundling
Historically, power systems have relied on traditional generation sources – coal, gas, hydro – to jointly supply capacity, energy and system services. In a renewables-based world, supply of these distinct system requirements will become unbundled.
Variable renewables like solar and wind supply energy in relatively predictable (and in the short-term, forecastable) quantities. But their maximum available capacity at any moment varies with sunlight and wind. To balance system needs, dispatchable (fully controllable) and flexible sources of capacity still need to be available. In a high-renewables system, these dispatchable sources will be a mix of hydro, storage (batteries and pumped hydro), and gas (or liquid-fuelled) thermal generation.
Hydro energy is renewable and very flexible, but limited by available water and suitable physical settings. In Australia, the best sites have already been developed. Storage is attractive because it enables time-shifting of variable renewable output that would otherwise be spilled when excess to demand. But batteries can’t economically store the very large amounts of energy needed to balance the highs and lows of wind and solar over periods of days or weeks. Pumped hydro, meanwhile, is slow to develop and highly capital-intensive
The economics is beyond the scope of this article, but thermally-fuelled generation like gas turbines or reciprocating engines are the least capital-intensive form of dispatchable generation, measured by investment cost per megawatt capacity. Their flexible capacity can cost-effectively complement the variable output from renewables while contributing a relatively small share of system energy. Even using fossil fuels, this low energy share – produced from a larger amount of system dispatchable capacity – means their total contribution to emissions, and to system operating costs, would remain small.
We can get a sense of how this plays out in a world of growing renewables by looking at historical trends and patterns in the utilisation of gas-fired generation in the NEM’s different regions. Looking into the future, modelling like AEMO’s ISP provides insights into how these patterns will evolve in a world of much higher renewable penetration.
Recent Trends
Let’s start with a small sample of seven days from the most recent quarter to illustrate the complementary nature of gas and renewables.
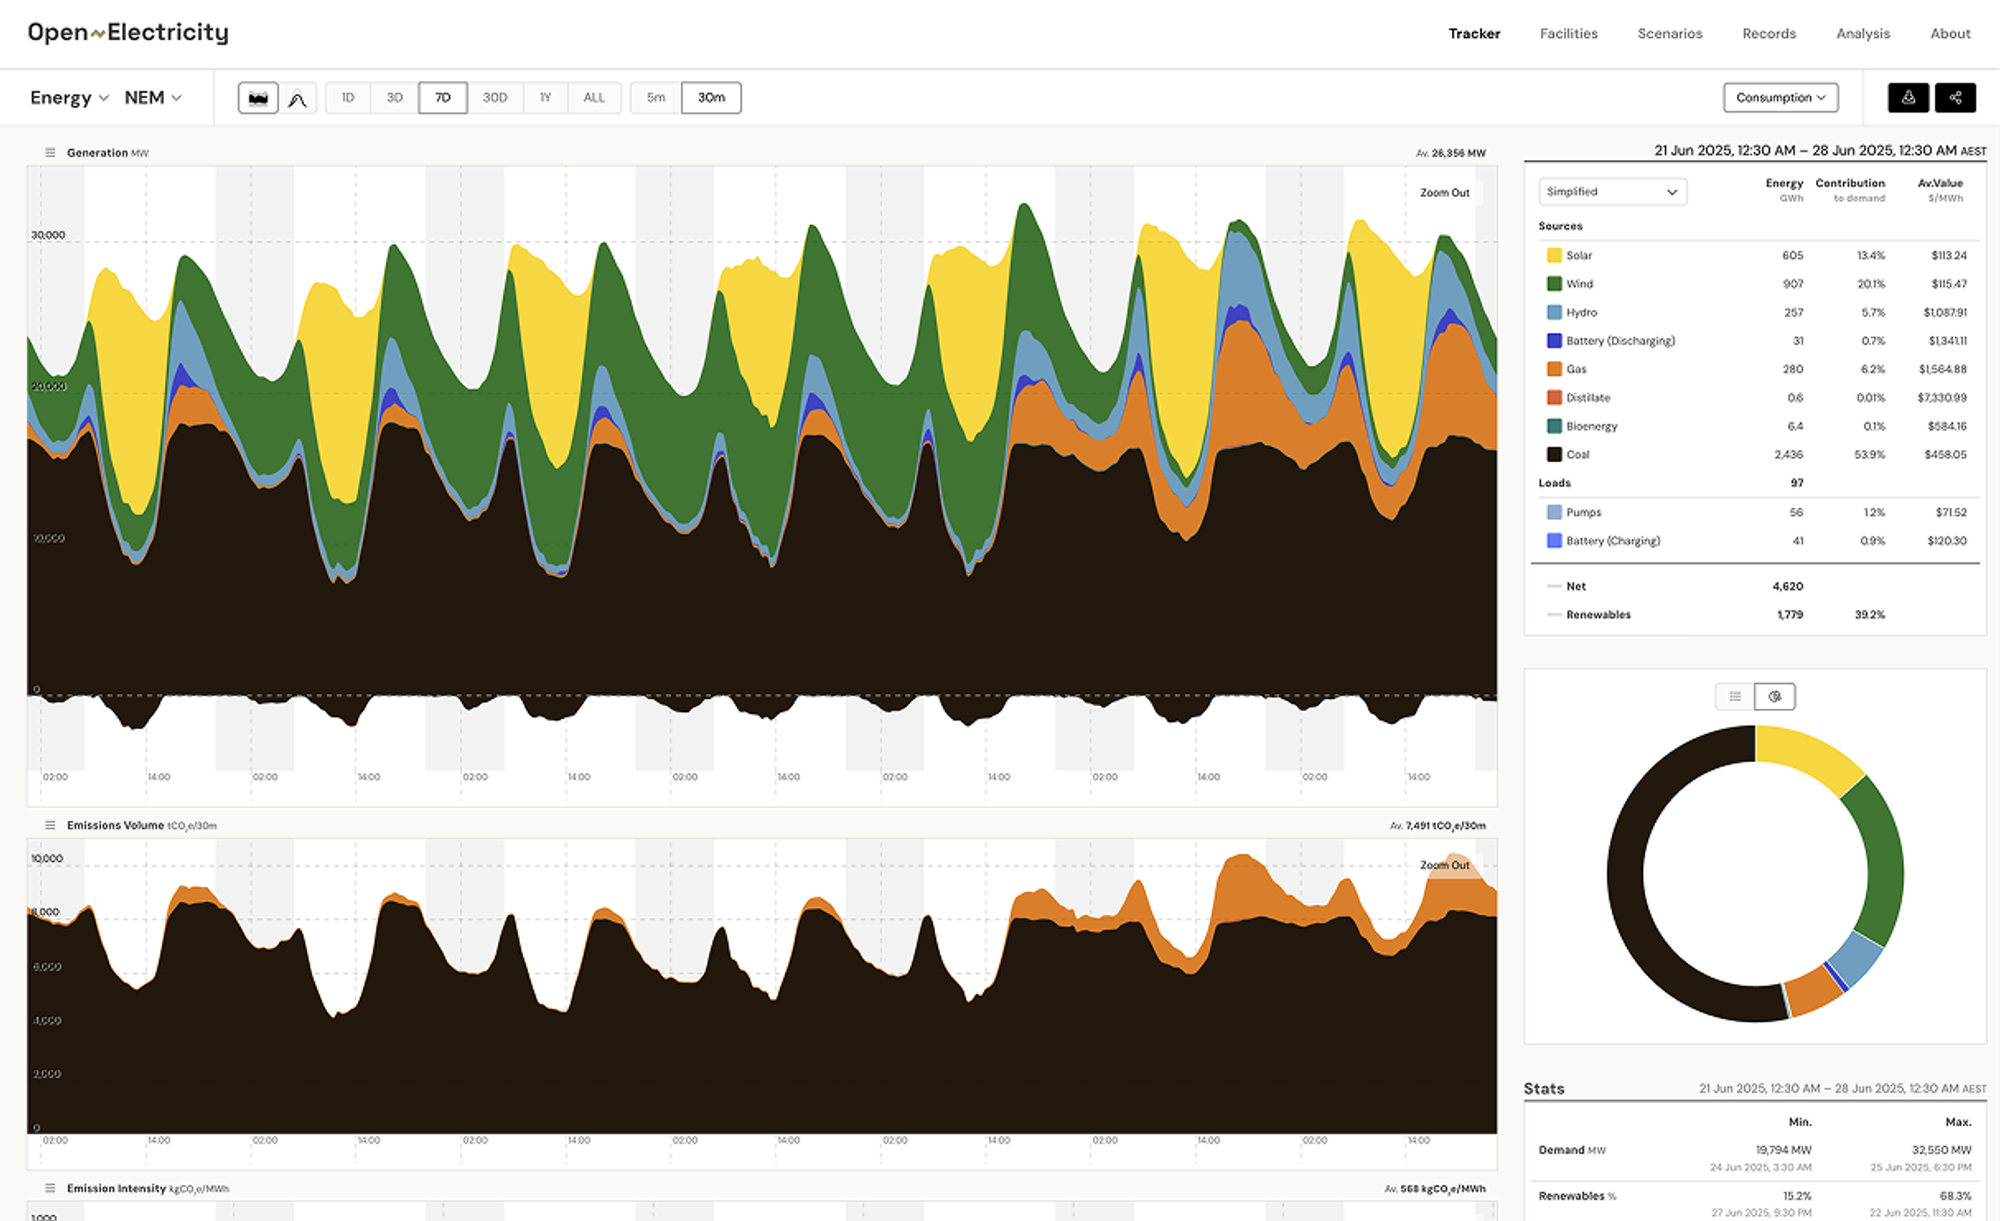
The first four days (21-24 June) show strong wind output and very low levels of gas generation across the NEM, essentially restricted to evening peaks. As battery storage capacity continues to grow, much of this daily peaking duty will likely switch from gas to batteries, recharging in the middle of the day and discharging through the peak.
But by the end of the week, wind output drops off and gas (along with hydro) shifts from pure peaking to a mid-merit role, with gas-fired generation running continuously and meeting up to 26% of system demand in some half hours. Yet for the week as a whole, gas’s share of energy production is still in single digits – under 6%.
A one-year view of gas-fired output at daily resolution reinforces its capacity-oriented role.
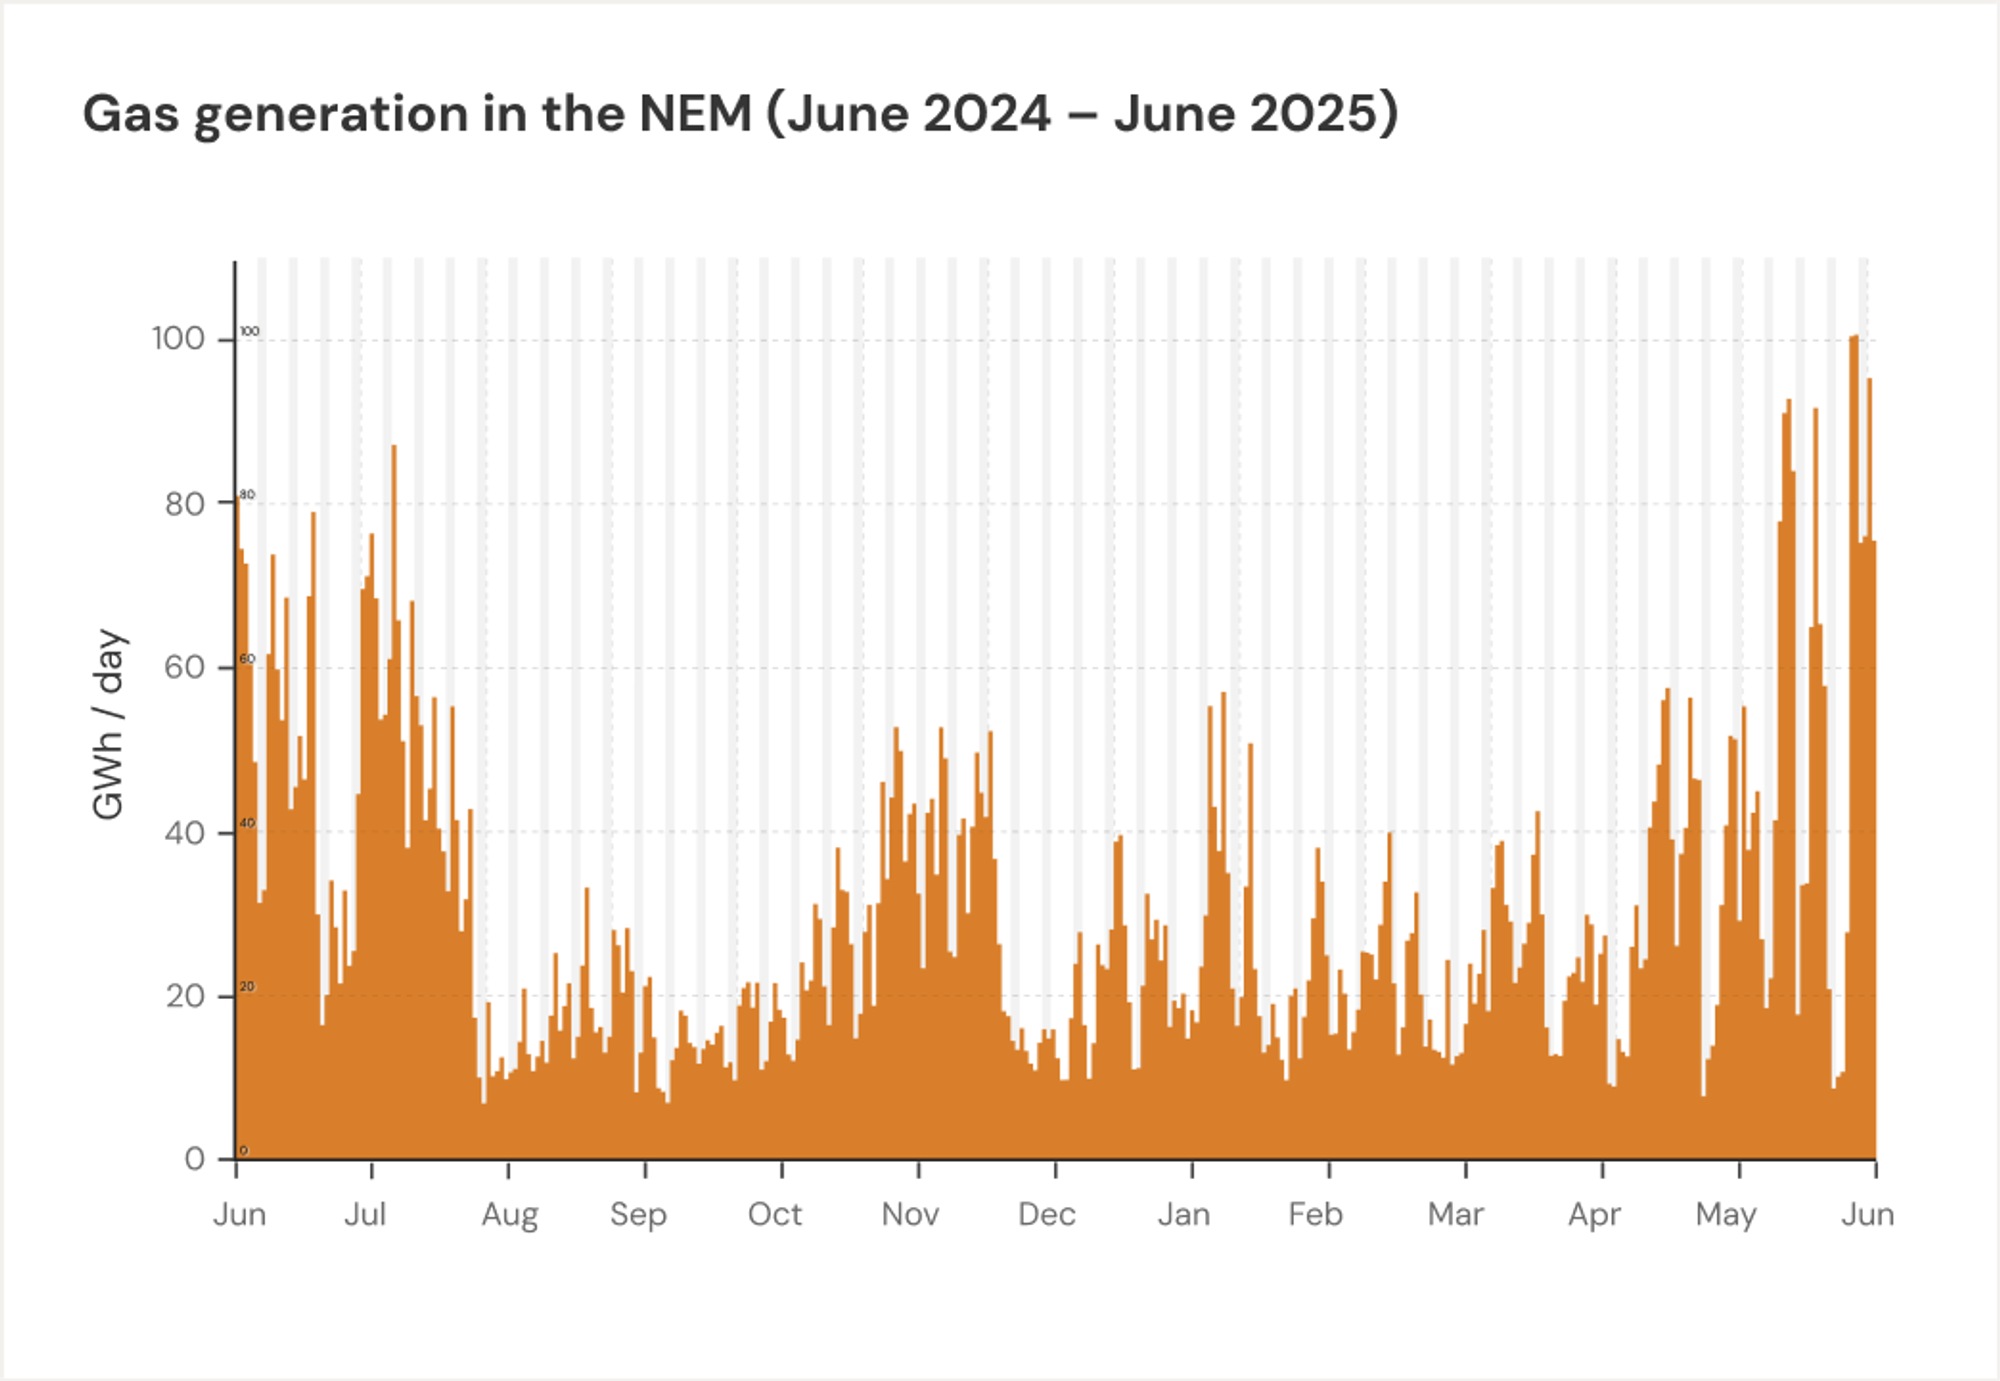
For the NEM as a whole, gas usage is highly variable. Over the last year it supplied less than one-twentieth of annual energy but up to a sixth of daily generation in some instances (generally concentrated in winter).
In some regions, this energy vs capacity split is even more marked. In Victoria, for example:
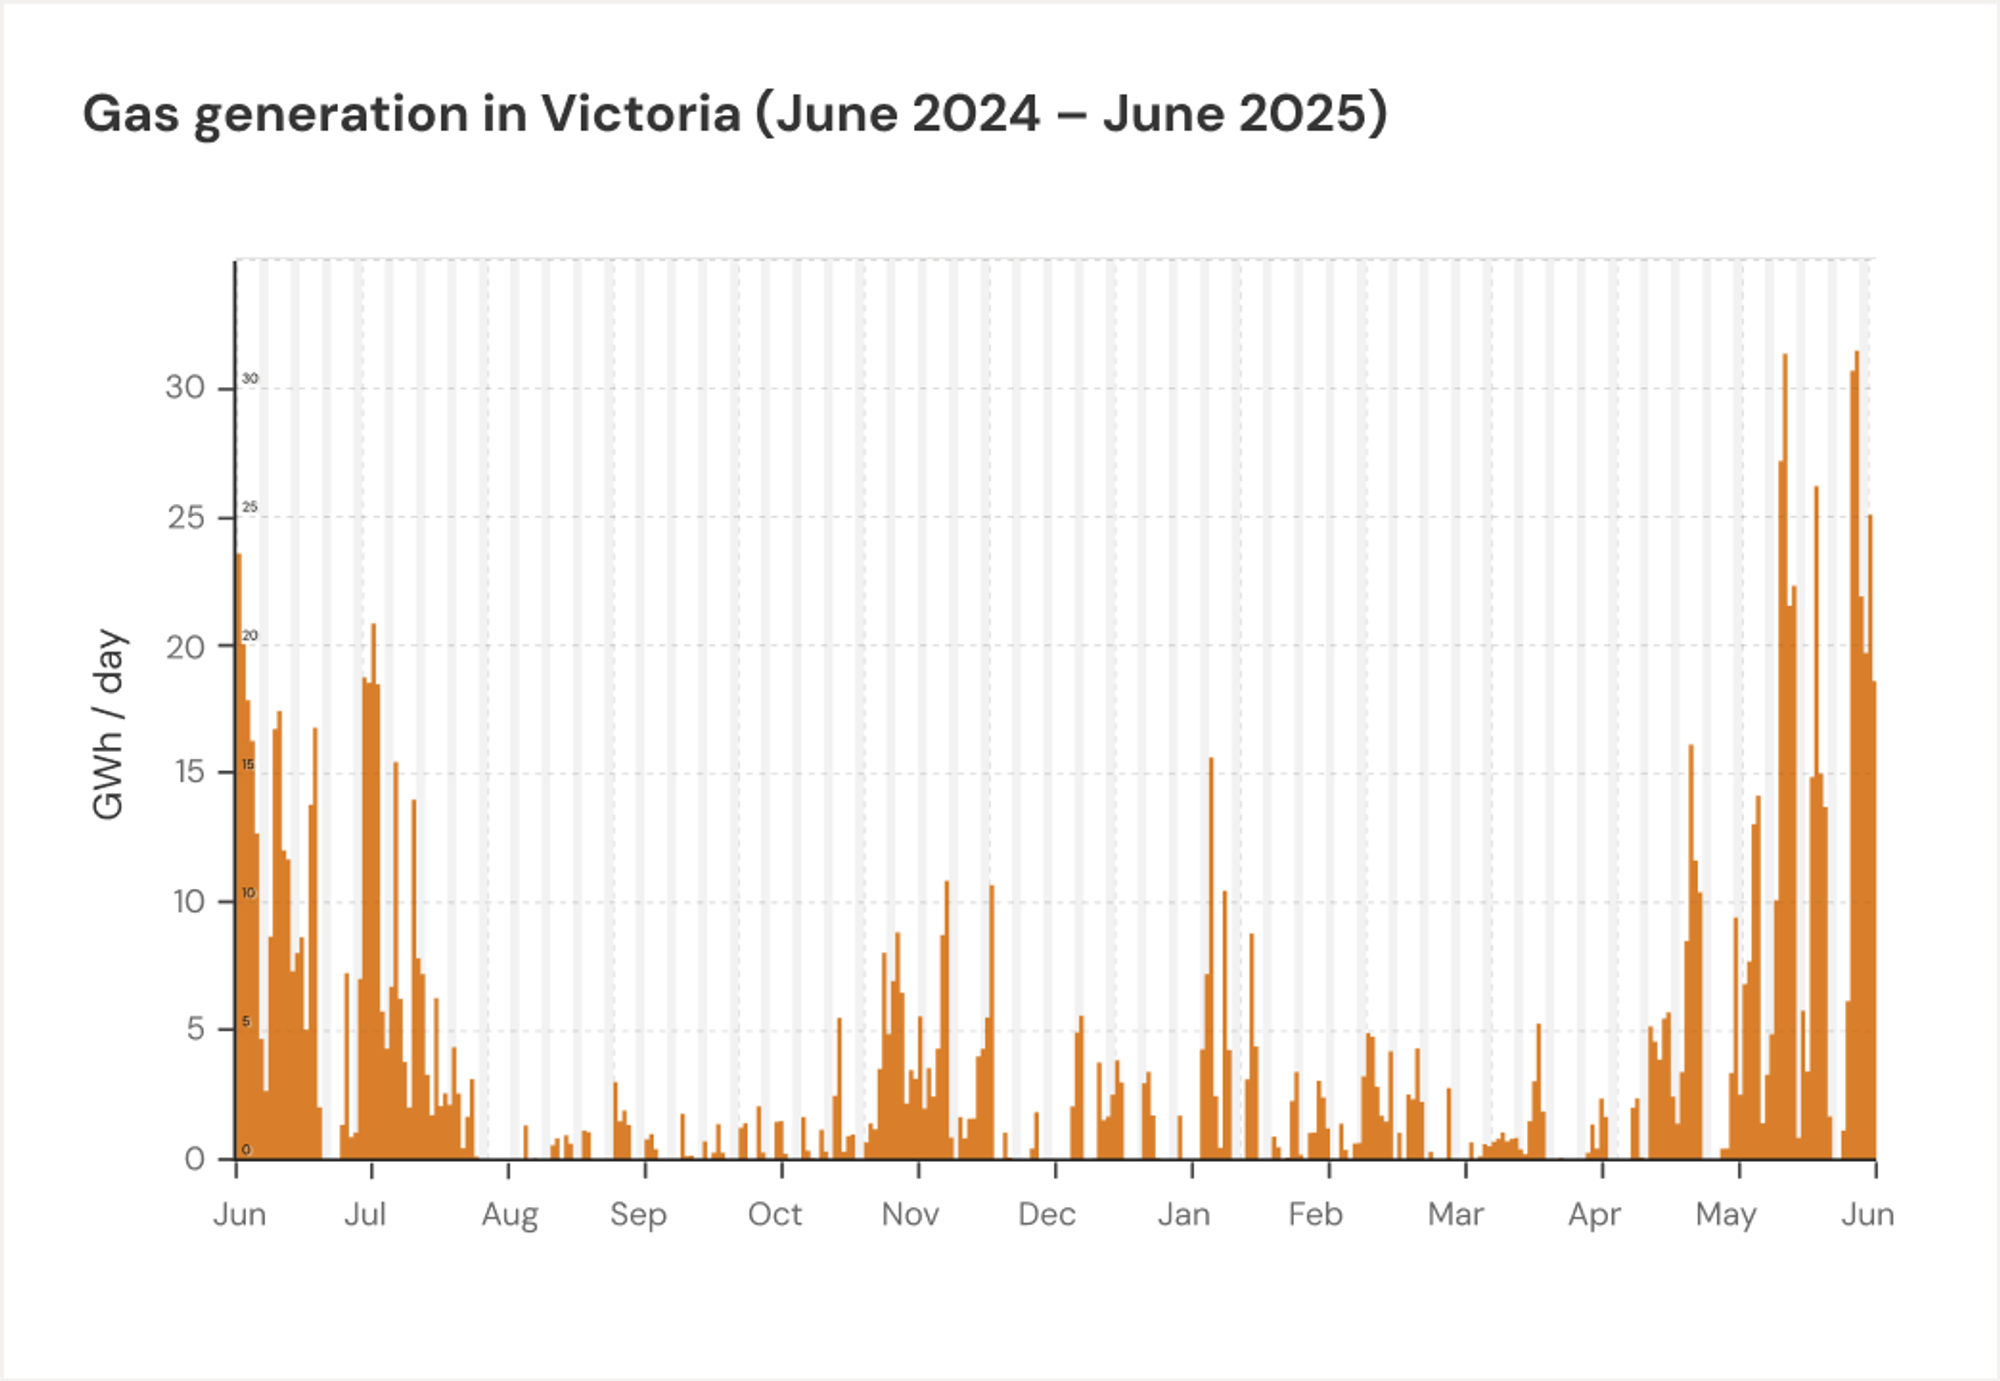
A couple of peak days late in Q2 2025 saw gas-fired plants delivering over 20% of Victoria’s generation output (which attracted some over-the-top media commentary at the time – discussed here with a more sober perspective). But across the year, it has accounted for only 2.5% of Victoria’s total energy generated.
What about the future?
Looking forward, AEMO’s ISP projections envisage a further shift in the role of gas-fired generation. By 2039-40, gas generation is expected to follow a dispatch pattern similar to the Victorian example above.
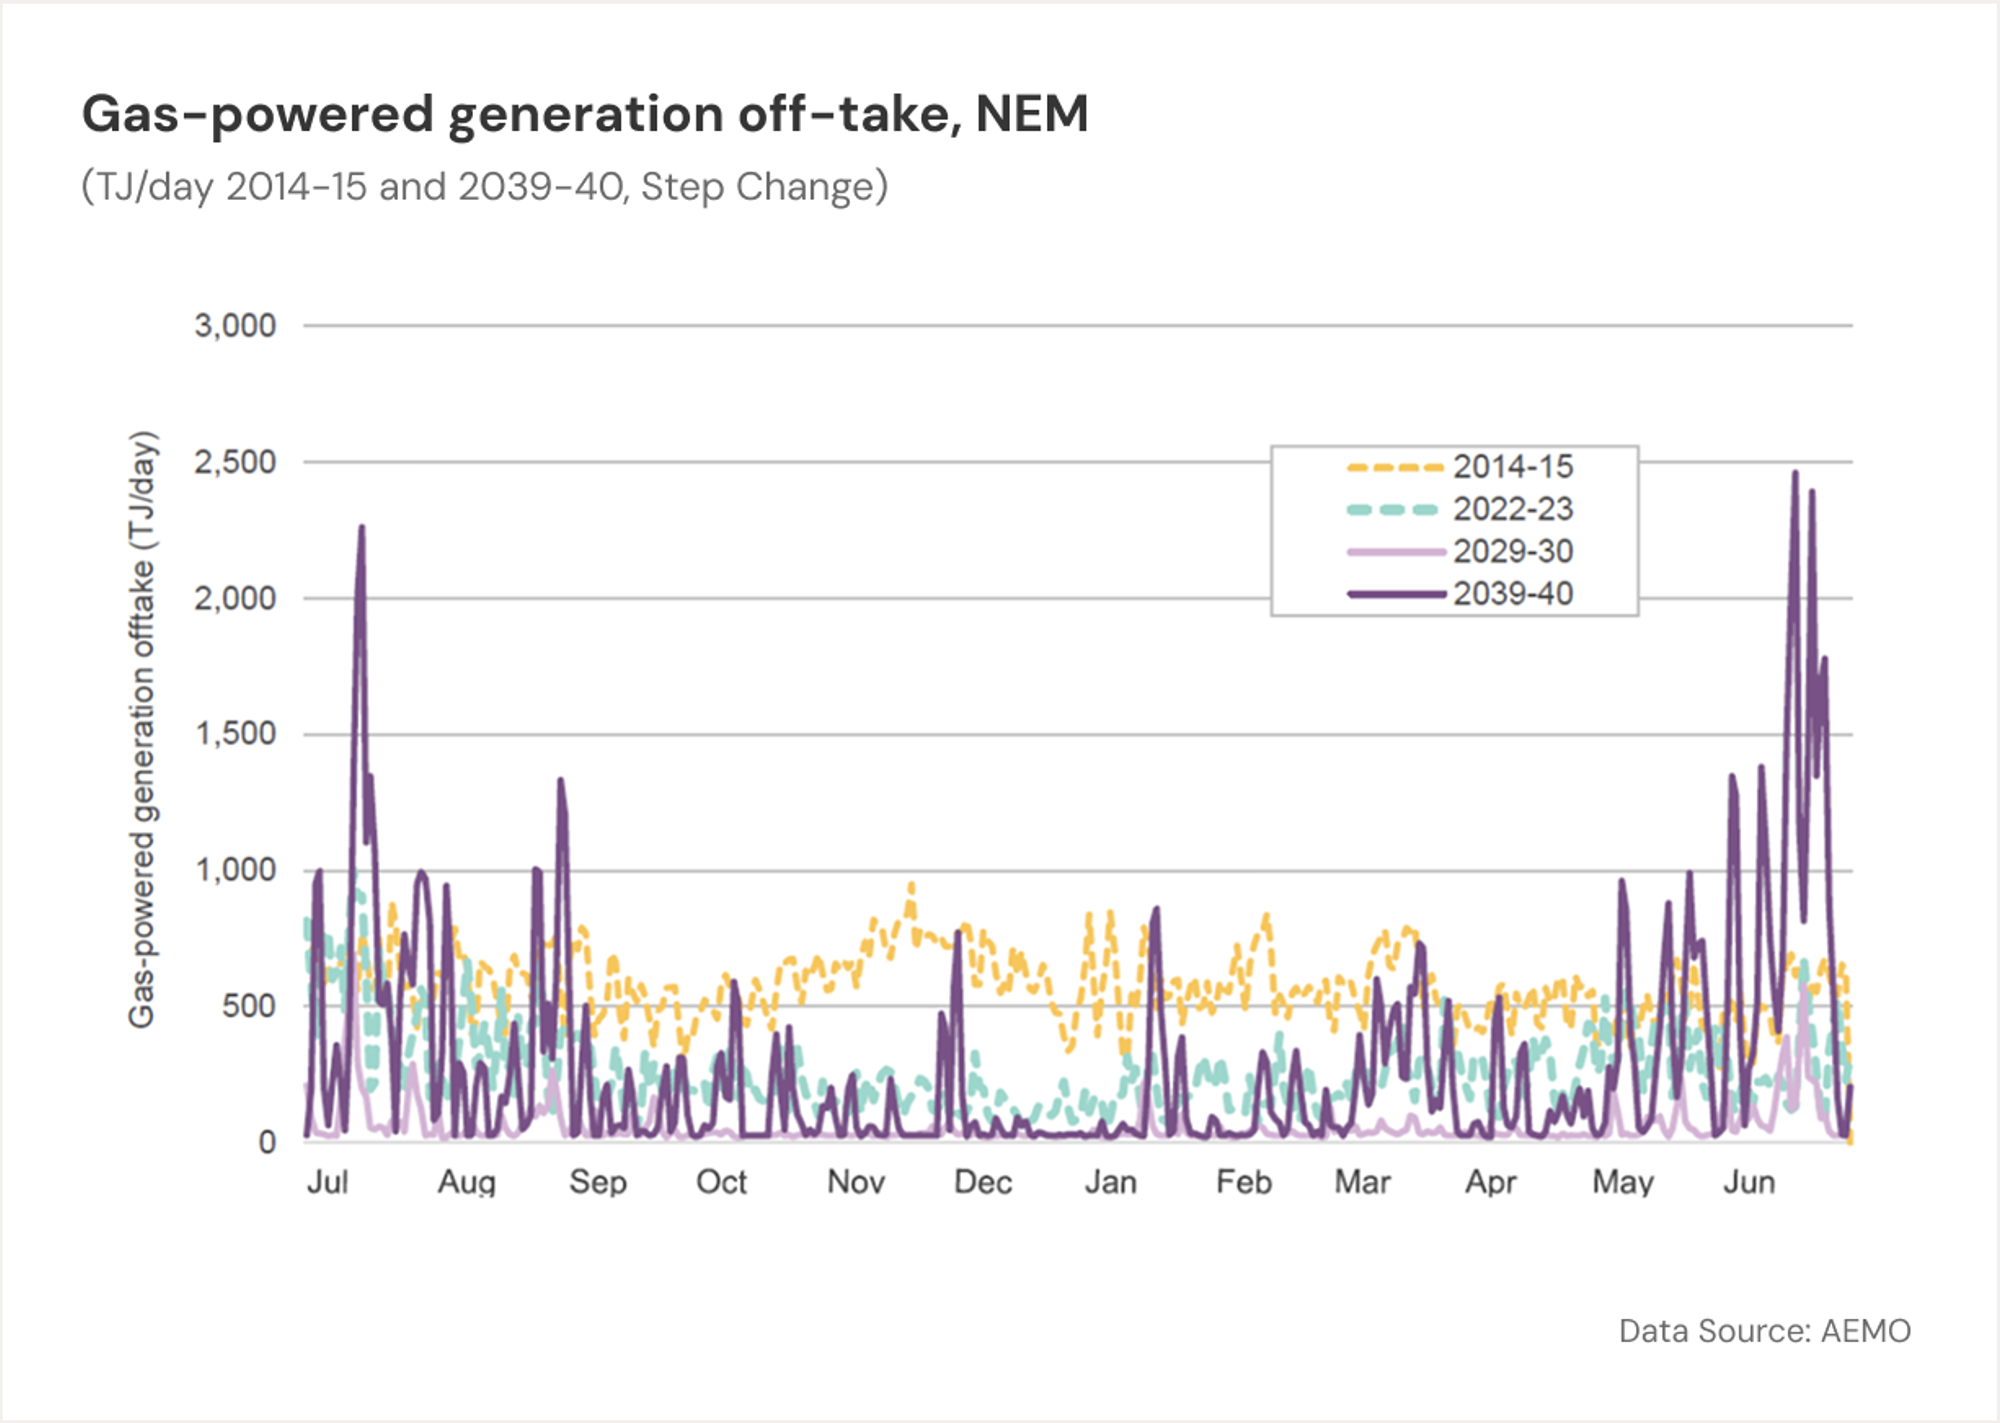
(This chart is scaled in TJ/day of gas utilisation rather than GWh/day of generation output – a rough conversion factor is to divide the TJ/d figure by 10 to yield equivalent GWh/d.)
This view sees peak daily gas generation increasing by a factor of about 2.5 from its current level of around 100 GWh/day. However, the same ISP forecast sees annual energy produced by gas in 2039-40 remaining about the same as in recent years, at 12,000 GWh. Again this highlights the capacity-focussed role of gas in covering intermittent episodes of low renewable output, rather than becoming a significant contributor to aggregate energy production.
There could certainly be challenges to upstream fuel delivery systems (production, storage, and pipelines) in accommodating this increased level of variability. A broader mix of source fuels (liquid hydrocarbons, biofuels, and/or hydrogen) and delivery arrangements, including on-site storage, might well be required rather than relying principally on pipeline natural gas.
But in principle, the direction of travel is clear: while different from the phased retirement of coal generation, understanding gas’s evolving role in the transition – and planning accordingly – is key.
___
This article is available for republishing under a Creative Commons CC BY-ND 4.0 licence. Please credit the author and Open Electricity, include a link to the original. Edits allowed only with explicit permission from the author.