Tracking the pulse of the grid: Introducing Records in Open Electricity

Making it easier to spot, understand and share the energy transition’s quiet breakthroughs.
Australia’s electricity system is in the midst of profound transformation. New technologies, new patterns of generation and demand, and new challenges are reshaping our grid day by day. And with change happening this quickly, it’s easy to miss the milestones.
That’s where Open Electricity’s new Records engine comes in.
Why records?
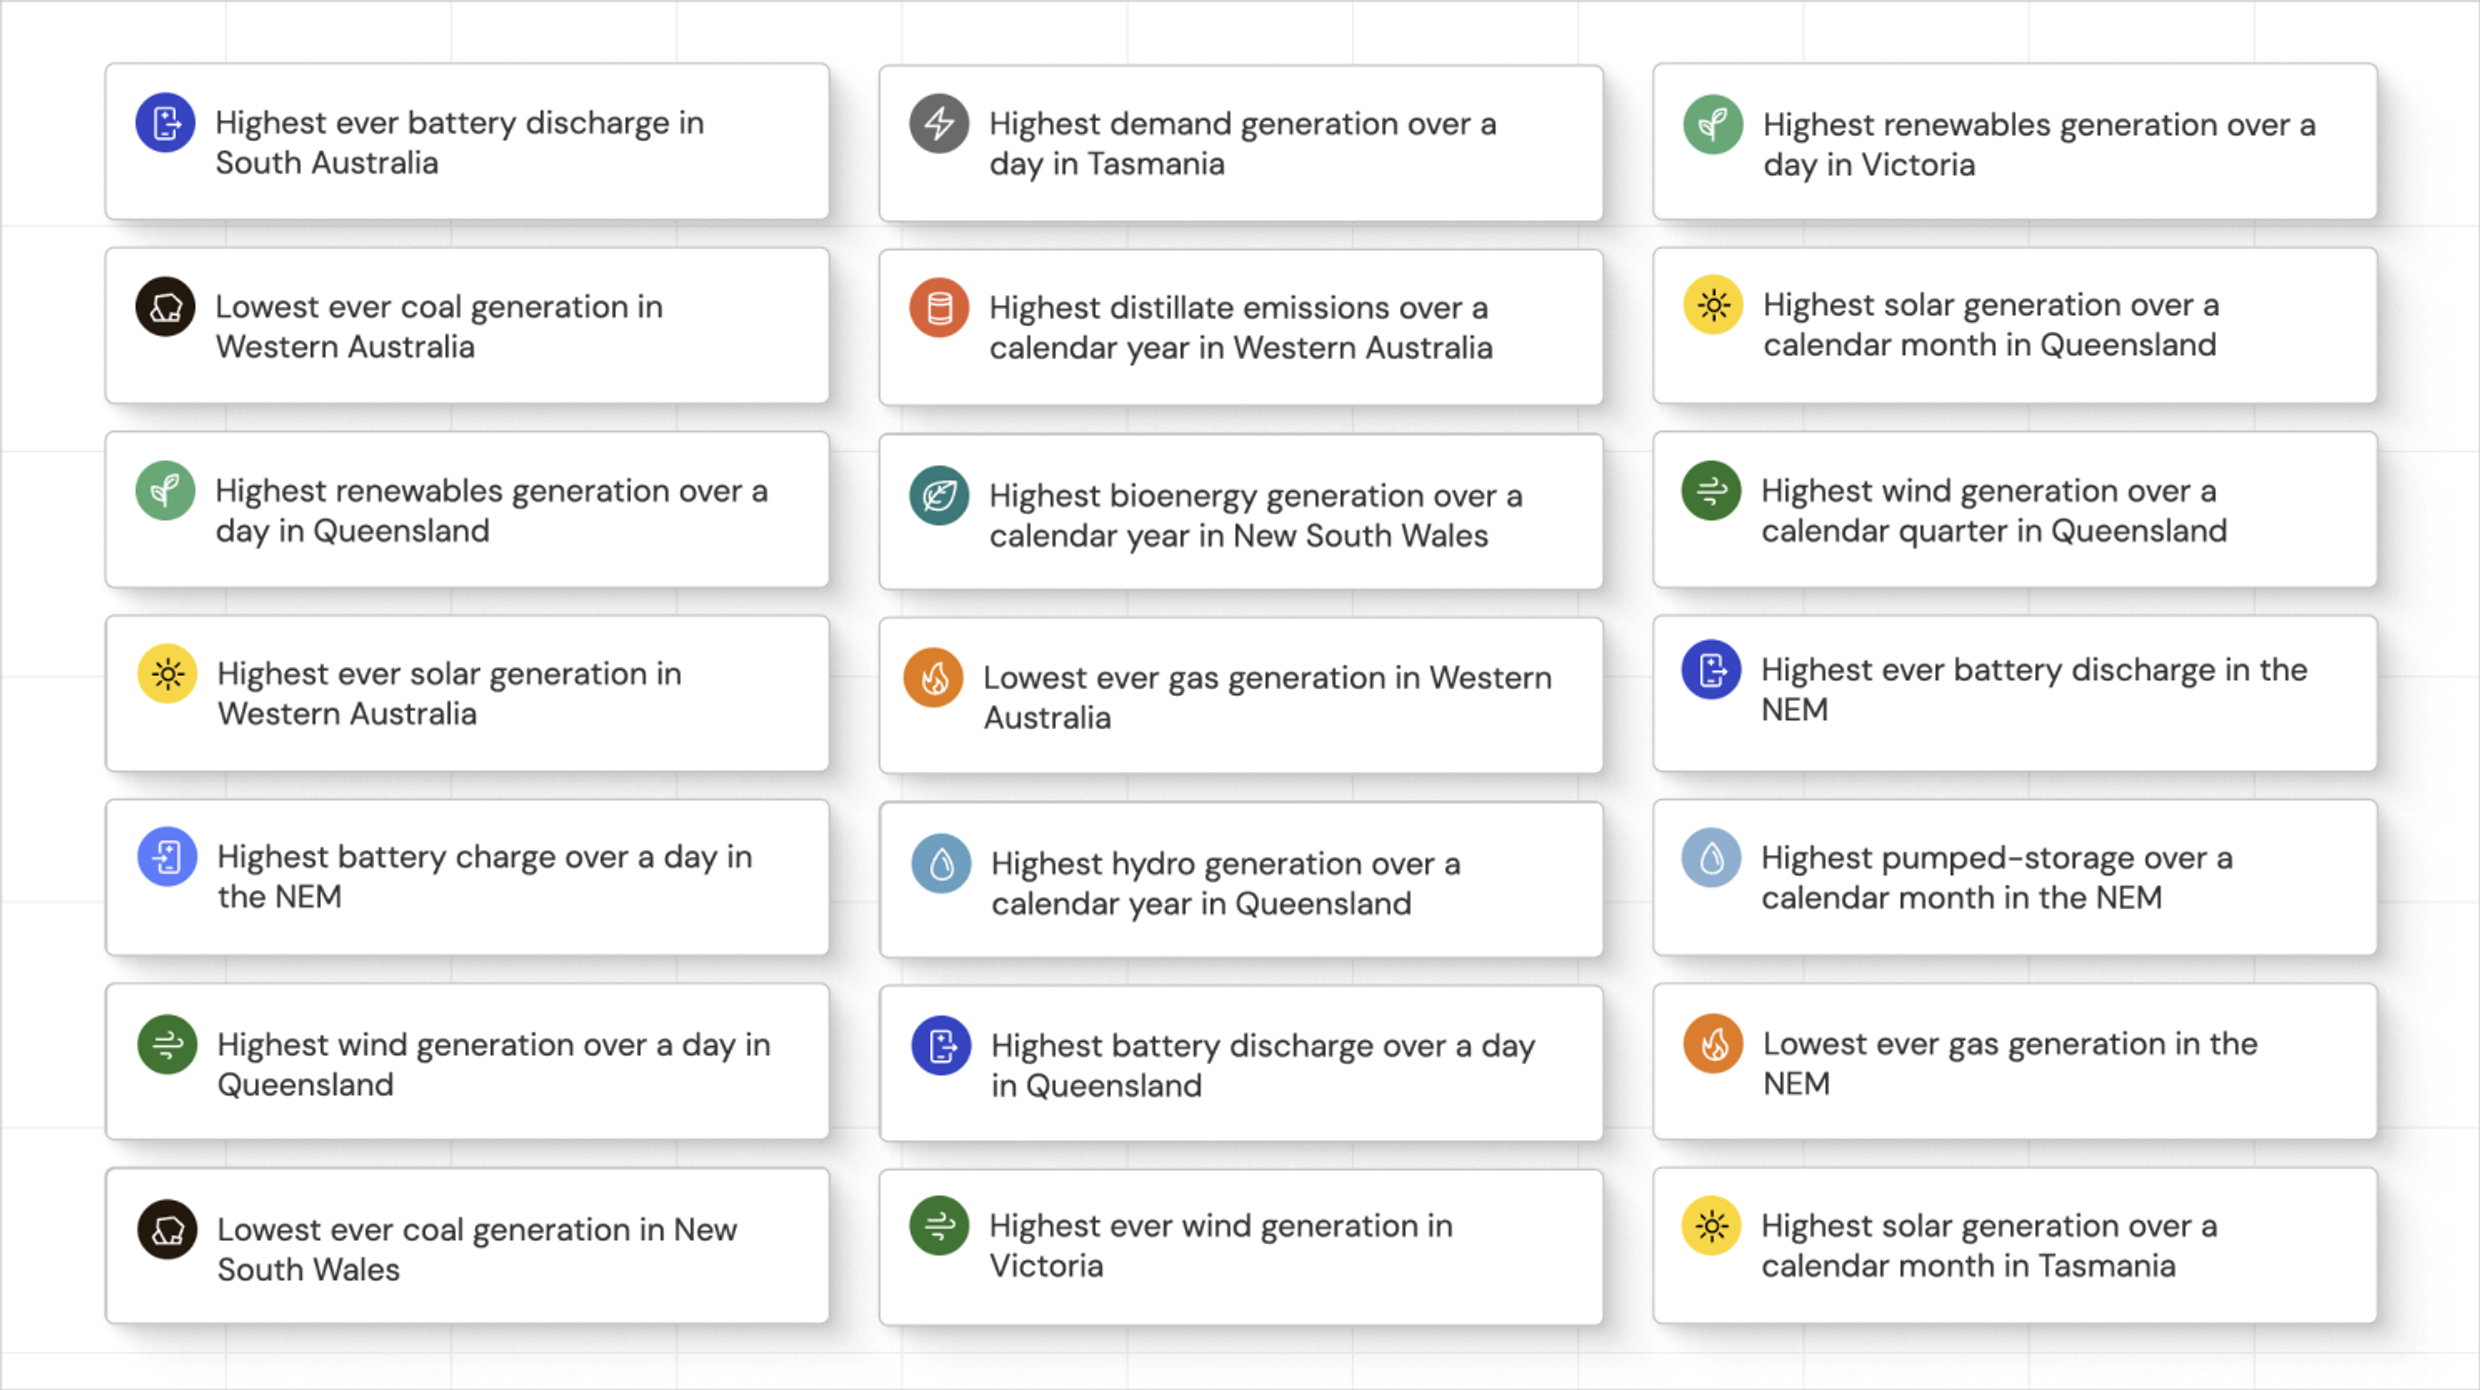
Designed to highlight significant moments on the grid – such as record renewables generation or battery discharges – Records makes it easier to track the energy transition as it happens. It’s part of a broader push to make the electricity system more legible, navigable and more open.
Records automatically identifies notable events across technologies, regions, metrics and timeframes, and publishes them in a clear, shareable format. It’s a way of capturing the pulse of the grid, one milestone at a time.
Recent Records
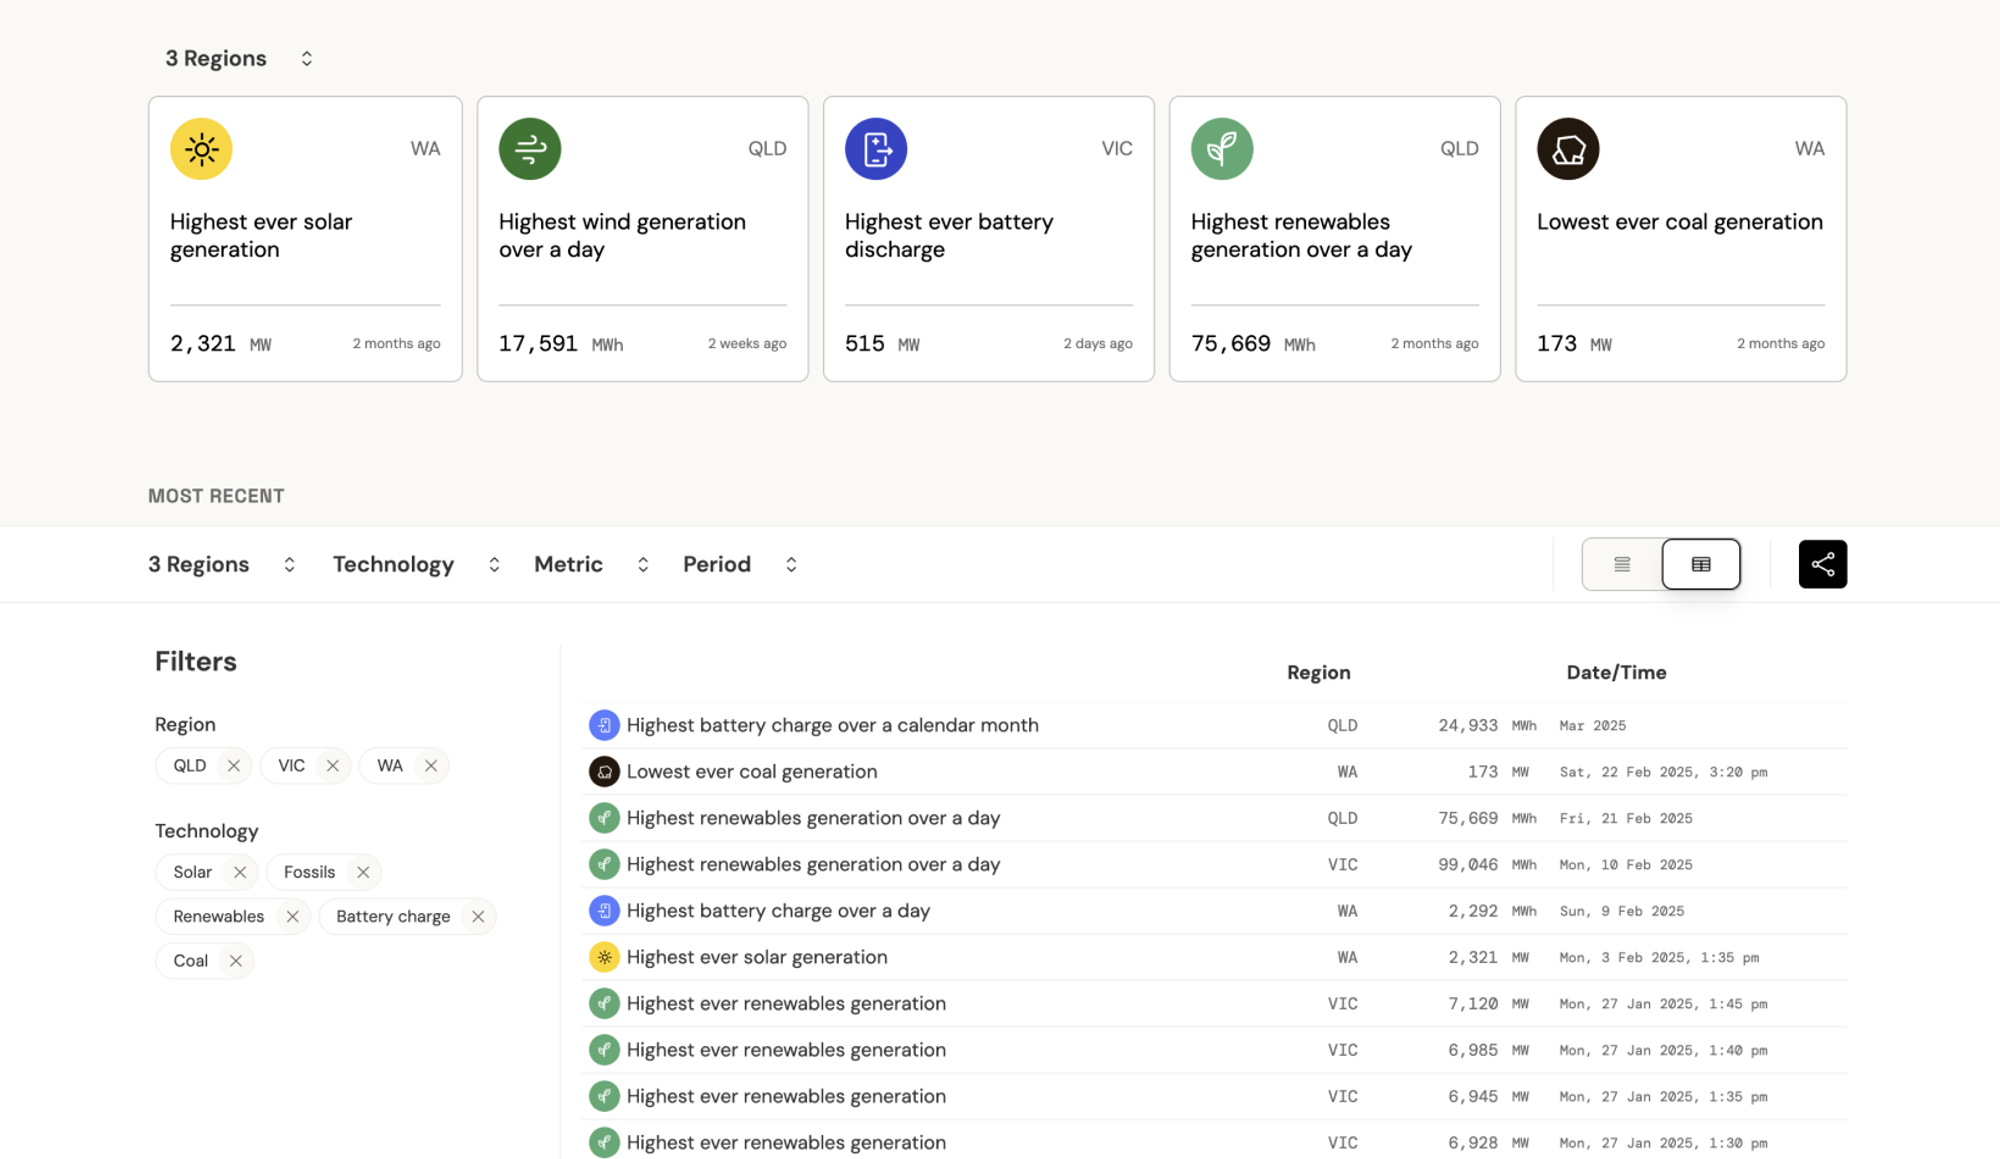
In the lead up to launch, Records has already captured a series of notable moments – particularly around battery activity, which has been ramping up rapidly across the electricity system.
In the last couple of months, Records tells us that:
- Queensland saw its highest wind generation over a day on April 8, at 1054 MW
- Coal generation in NSW dropped to its lowest level on record, at 1445 MW, on April 5
- Victoria recorded its highest ever battery discharge at 515MW, early on the morning of April 5
- The National Electricity Market (NEM) hit a record battery charge total for a single day – 4832MWh on March 20
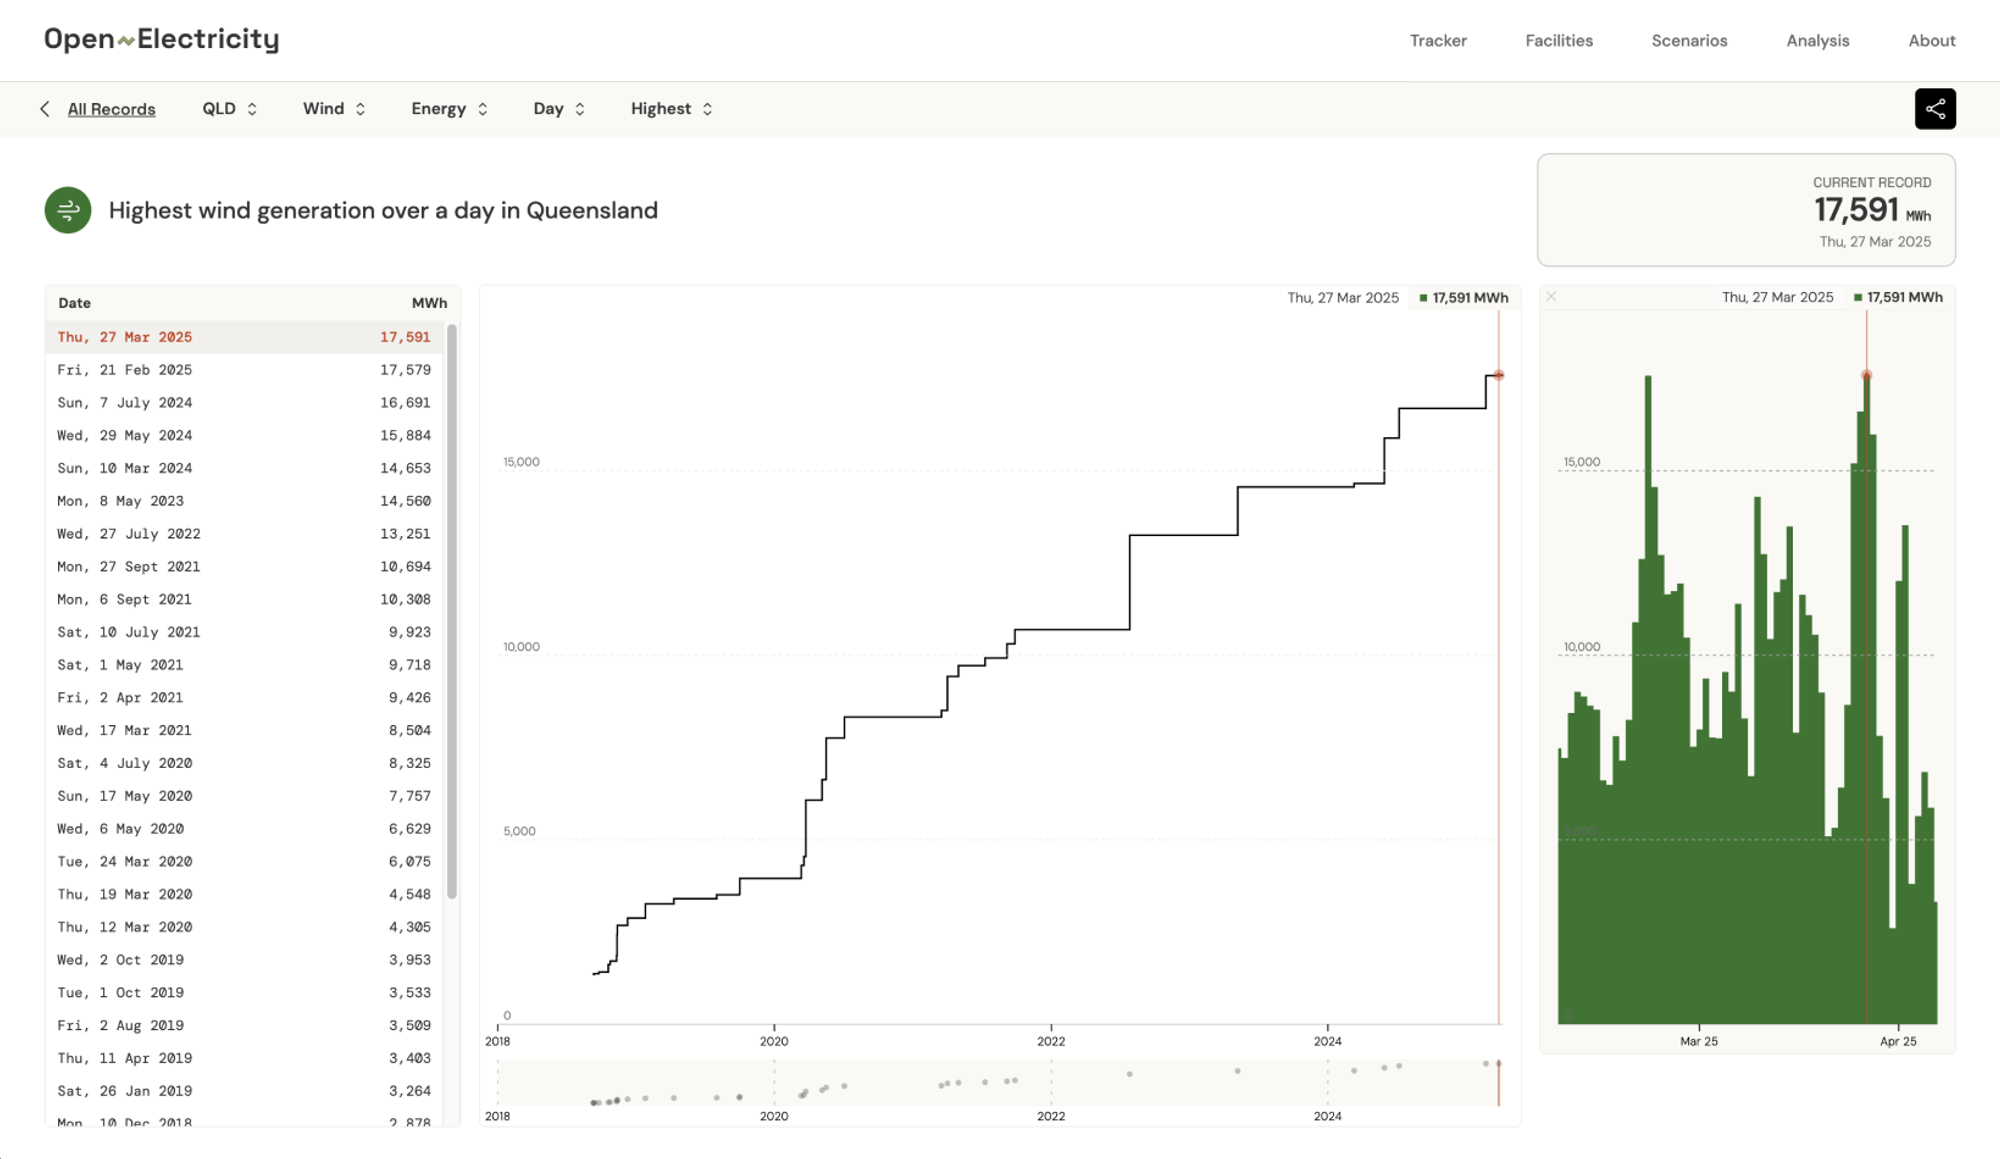
Clicking on any record opens up its history – a view of how that value has changed over time. It shows when previous records were set, how frequently the record has been broken, and the nature of the progression.
For example, Queensland’s record for highest renewables generation over a day – last broken on 21 February 2025 – capped off a surge of renewable output over the 2024-25 summer period. Viewing the record on a longer timeline reveals a pattern: steady growth spurts in summer almost every year since 2016. These historical views help place each milestone in context, showing not just a moment, but a trend in motion.
These records offer more than just trivia. Each one hints at broader system shifts – new storage coming online, favourable conditions for wind or solar, or the steady decline of fossil fuel baseload. They also give policymakers, journalists and researchers a prompt to dig deeper into what’s driving these shifts.
Follow the feed
To help make these records more visible in real time, we’ve set up a dedicated Twitter/X account, @OpenElecRecords. Here, new records will be posted automatically, giving users a steady stream of significant moments from across the grid. We also aim to provide some light analysis of recent records in periodic newsletter updates – and plan to expand to Bluesky soon.
If you’ve subscribed to OpenNEM or Open Electricity email updates in the past, we highly recommend signing up again (in footer). We’re rebuilding our list from scratch, and we don’t want you to miss out.
In the meantime, we invite you to explore, share and follow along as the story of the grid continues to unfold – one record at a time.
You can explore Records now at openelectricity.org.au/records
And follow along live at @OpenElecRecords on Twitter/X.